> For the complete documentation index, see [llms.txt](https://docs.phocassoftware.com/llms.txt). Markdown versions of documentation pages are available by appending `.md` to page URLs; this page is available as [Markdown](https://docs.phocassoftware.com/budgets-and-forecasts/contributor/customize-your-view/group-period-columns.md).
# Group period columns
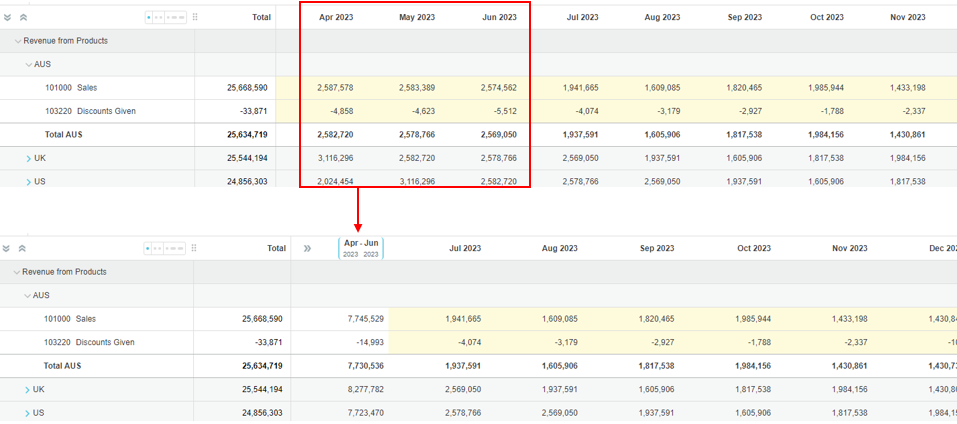
Group several period columns in a worksheet into one column that displays the total of value.
{% hint style="info" %}
User permission: Budgets & Forecasts
{% endhint %}
The column header of the period column group identifies the periods (columns) in that group. The values you see in a period column group are the total of the values in the individual periods.
There are many reasons why you might want to group columns, such as to:
* Group past periods into one summary column, so that data is hidden from view and you can focus on the remaining months in the budget period.
* Group a couple of weeks together to view a fortnightly budget.
* Group three months together to get a summary total of the budget values in that quarter.
* View your budget values at a summary time period level, such as quarters, and avoid the need to scroll across the worksheet.
### Create a group
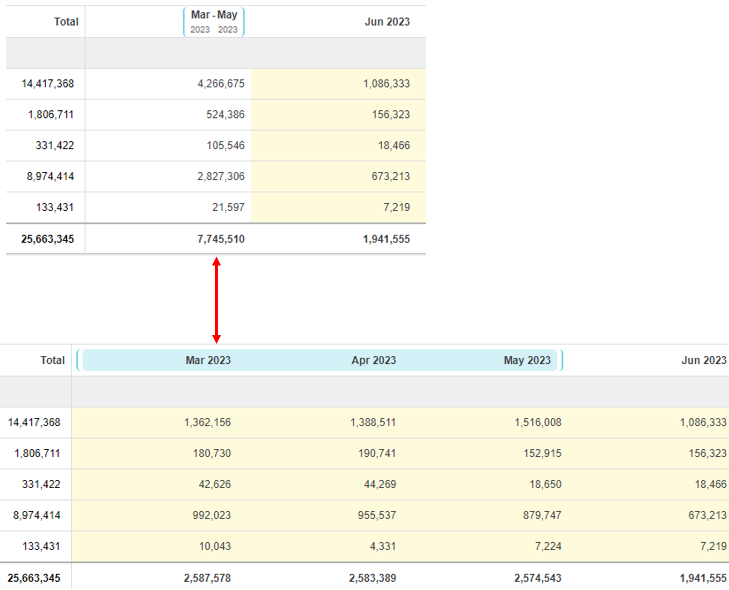
If you are the budget owner and you create column groups, the groups display initially in a ‘collapsed’ state for you; you cannot edit the values in the cells (white background). However, you can use the spread feature to change the total value. When contributors open the workbook, they will see those groups in the expanded state (yellow background), so they can edit the values (according to the workflow).
Contributors also have the ability to create column groups, to meet their data entry needs. These changes do not impact the column groupings set by the budget owner.
Column groups are retained the next time you (budget owner and contributors) load the workbook. However, they are removed when you copy a budget forward or change the start or end dates.
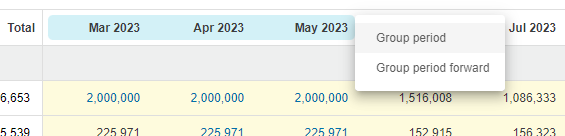
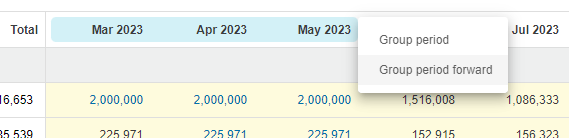
1. Click the header of the first period column you want to include in the group > hold and drag your mouse across the headers of the other columns you want to include in that group > release your mouse. The headers of the selected columns are highlighted blue and the grouping menu displays.
2. Select the required grouping method:
* Click **Group period** to group the selected period columns into one ‘total’ column. You can repeat this action manually for other periods in the worksheet
* Click **Group period forward** to group the selected period columns into one ‘total’ column and group the subsequent period columns in the same way. This quickly creates a batch of ‘repeating’ column groups based on the number of period columns in the first group.
### Expand or collapse a group
To view the period columns within a group, click the header of the group to expand the group. You can then edit the values as usual (yellow background) if you have been assigned tasks in the workflow.
Click anywhere in the blue highlighted column header area to collapse the group and view the group total again.
### Spread totals within a group
In the collapsed state, you can use the [spread](/budgets-and-forecasts/contributor/edit-values-in-a-worksheet/spread-totals.md) feature to change the total values of a group and spread it across the periods within that group.
### Ungroup columns
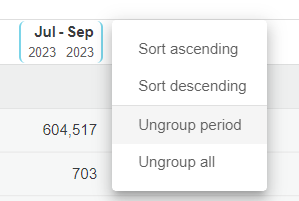
Right-click anywhere in the blue highlighted column header area and click **Ungroup period** to ungroup that group, or click **Ungroup all** to remove all groupings.
---
# Agent Instructions
This documentation is published with GitBook. GitBook is the documentation platform designed so that both humans and AI agents can read, navigate, and reason over technical content effectively. Learn more at gitbook.com.
## Querying This Documentation
If you need additional information that is not directly available in this page, you can query the documentation by asking a question.
Perform an HTTP GET request on the following URL with the `ask` and `goal` query parameters:
```
GET https://docs.phocassoftware.com/budgets-and-forecasts/contributor/customize-your-view/group-period-columns.md?ask=&goal=
```
`ask` is the immediate question: it should be specific, self-contained, and written in natural language.
`goal` is what the user is ultimately trying to achieve, the reason they need the answer. Sharing it helps GitBook give you a better, more relevant answer. A goal is most helpful when it describes the outcome the user wants rather than restating the question. For example, with `ask=how do I create an API token`, a goal like `automate deployments from our CI pipeline` lets GitBook tailor the answer to that use case.
The response will contain a direct answer to the question and relevant excerpts and sources from the documentation.
Use this mechanism when the answer is not explicitly present in the current page, you need clarification or additional context, or you want to retrieve related documentation sections.