# Edit a financial statement (Beta)
{% hint style="info" %}
**This feature is currently in beta, and the content on this page is temporary.**\
It will be merged into the main documentation when the feature becomes generally available.
{% endhint %}
{% hint style="info" %}
User permission: Manage Custom Statements
{% endhint %}
In the [statement list](https://docs.phocassoftware.com/financial-statements/managing-statements/overview-of-manage-financial-statements-beta/manage-financial-statements-beta), click the statement you want to edit. It opens in the editing area on the right.
## Get familiar with the editing area
The image below identifies the key elements of the editing area.
{% hint style="success" %}
Click the **Hide** button on the statement list to get a better view of the editing area.
{% endhint %}
### 1. Statement details
The details at the top give you context.
* **Name**: Confirm you have the right statement open.
* **Based on dimension**: The dimension that manages the account mapping. See [Overview of dimensions in Financial Statements](https://docs.phocassoftware.com/financial-statements/getting-started/overview-of-the-link-between-financial-statements-and-dimensions).
* **Revenue row**: The account group that represents the [revenue row](#set-the-revenue-row) in the Profit and Loss statement.
### 2. Statement items and options
The editing area opens on the **Edit statement** tab. In the center, you can see the items in the statement. On either side, there are action buttons and settings.
#### Statement items
Each item in the list matches a top-level row in the statement. Items display here in the same order as the statement grid.
Types of items you might see:
* **Group**. A category of accounts, like Revenue or Expenses.
* **Calculation**. A calculated row, like Gross Profit or EBITDA.
* **Heading**. A label row you add for readability.
* **Spacer**. Blank space between items.
* **Balance**. Cash Flow only. Cash at the start and end of period.
#### Options
The following actions and settings are available for customizing the statement contents and layout:
*  [Move](#reorder-items) items to reorder the statement.
* [Add](#add-an-item) a new item (group, calculation, heading, or spacer).
*  [Show or hide](#show-or-hide-an-item) an item in the statement.
* Change the number format for [calculation](#add-a-calculation) results.
* [Reverse sign](#reverse-the-sign-of-a-group) of a group to display a negative number as a positive, or vice versa.
* [Set the style](#set-the-style-of-an-item) of a group or calculation to control how it looks in the statement.
* [Delete](#delete-an-item) the item from the statement.
## Set the revenue row
The **Revenue row** setting is available in Profit and Loss statements only. It's used to drive the **% Revenue** calculation that can be turned on in the statement grid via the **Columns** menu.
Select the correct account group from the dropdown list in the top-right corner.
## Reorder items
Change the order in which the groups, calculations, headings, spacers, and balances (if applicable) appear in the statement.
Click and hold an item’s move button (a blue box displays around the row), then drag the item up or down to its new position. Reorder the other items as required.
{% hint style="success" %}
If you add groups (sub-dimensions) for the accounts in the statement, you can [apply a custom sort order](https://docs.phocassoftware.com/financial-statements/manage-dimension-groups#apply-a-custom-sort-order) for the items in those groups.
{% endhint %}
## Rename an item
Use descriptive names to help users understand the item's contents.
Click in the item's name box and edit the name as required.
## Add an item
The items in a financial statement here appear as rows in the statement grid.
See [Take a tour of Financial Statements](https://docs.phocassoftware.com/financial-statements/getting-started/take-a-tour-of-financial-statements) to learn about the rows in the statement grid.
### Add an account group
The account groups you see here display as grey rows in the statement grid.
{% hint style="info" %}
You can only add account groups in statements based on custom dimensions.
If the statement uses an existing mapping dimension that is shared with another statement, you can’t add, edit, or delete account groups, or remap accounts.
{% endhint %}
If the statement uses a custom dimension, you can add new groups, edit existing groups, and delete groups you no longer need.
For example, suppose your Profit and Loss statement has one Revenue group but you want to view your revenue value split into two categories, Retail and Online. You can add another group of revenue accounts and edit the existing group accordingly.
1. Click the **Add** button where you want to insert the new group and select **Group**.
2. Enter a name for the group.
3. Edit its [**Reverse sign**](#reverse-the-sign-of-a-group) and [**Style**](#set-the-style-of-an-item) settings as required.
4. Proceed to [map accounts to the group](#map-accounts-to-a-group).
### Map accounts to a group
{% hint style="info" %}
You can only add and edit account mappings in statements based on custom dimensions.
{% endhint %}
When you add a group, you need to map accounts to that group, so they display in that group in the statement, such as Revenue, Cost of Sales, and so on. You might also need to edit the account mapping for an existing group, if circumstances change.
Unmapped accounts display in the **Suspense** row in your statement, as illustrated in the image below.
Click the **Map accounts** tab. This tab displays your chart of accounts in a grid. The **Mapping** column shows the group each account is mapped to. If an account is not mapped, this column is empty.
Continuing with the example above where you added a new group for Online Revenue, now you need to map the applicable accounts into the Online Revenue group.
1. Search for the accounts that belong to the group. You can search by code, name or other property, or enter an account range. Alternatively, you can select the **Hide mapped accounts** checkbox to only see the accounts that need to be mapped.
2. Select the checkboxes of the accounts or click and drag to select multiple accounts at the same time. The header on the **Mapping** column turns into a dropdown list.
3. Click the **Mapping** column header and select the group from the list. If you selected multiple accounts, your group selection will apply to all those accounts.
4. Either click the **Edit statement** tab to continue editing the statement, or [save your changes](#save-your-changes) now.
{% hint style="success" %}
You can create additional groupings for your dimensions to enhance analysis in your financial statements. See [Manage groups (sub-dimensions)](https://docs.phocassoftware.com/financial-statements/managing-statements/manage-dimension-groups).
{% endhint %}
### Add a calculation
The calculations you see here display as white rows in the statement grid. You can add new calculations, edit existing calculations and delete calculations you no longer need.
Calculations can be basic formulas that refer to groups or other calculations in the statement. They can also be more complex formulas that include [functions](https://docs.phocassoftware.com/financial-statements/managing-statements/customize-a-financial-statement/customize-calculations/functions-for-profit-and-loss-calculations), used to calculate [financial ratios](https://docs.phocassoftware.com/financial-statements/managing-statements/customize-a-financial-statement/customize-calculations/financial-statements-formulas-for-common-ratios) (such as Days in Period), refer to statistical streams, and include groups from Balance Sheets.
For example, suppose you want to view the gross profit margin in your Profit and Loss statement. You can achieve this by adding a calculation.
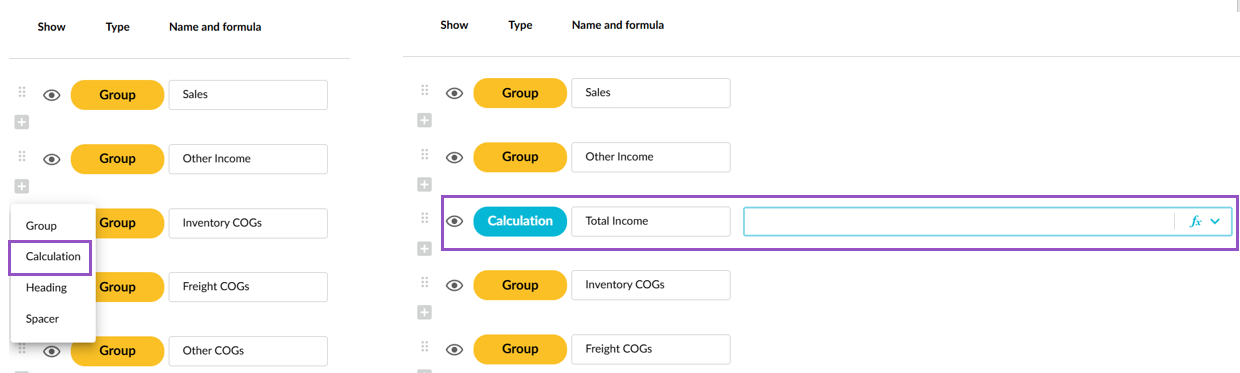
1. Click the **Add** button where you want to insert the new calculation and select **Calculation**.
2. Enter a name for the calculation.
3. Enter the calculation formula:
1. Click in the calculation box to activate it.
2. Enter mathematical symbols and reference to other items in the statement to build your formula. To refer to a group or calculation, click that item's colored button to automatically insert it into the formula.
3. Use the inbuilt [functions](https://docs.phocassoftware.com/financial-statements/managing-statements/customize-a-financial-statement/customize-calculations/functions-for-profit-and-loss-calculations) and standard [financial ratio formulas](https://docs.phocassoftware.com/financial-statements/managing-statements/customize-a-financial-statement/customize-calculations/financial-statements-formulas-for-common-ratios) as required.
4. Change the default **format** of the calculation result, if required. You can select from a list of default formatting options or create your own custom formatting.
5. Edit its [**Style**](#set-the-style-of-an-item) settings as required.
### Add headings and spacers
Headings and spacers are purely visual elements that make it easier for users to consume the information in the statement.
* **Headings** allow you to include additional information in the financial statement. For example, you might want to add a descriptive heading to display underneath the financial statement name or split the statement into sections with clear headers.
* **Spacers** allow you to add some formatting to the financial statement by inserting white space between the items.
Click the **Add** button where you want to insert the new item, then select **Heading** or **Spacer**. If you added a heading, enter the text you want to display.
## Show or hide an item
{% hint style="warning" %}
If you need to use these groups in Budgets & Forecasts (B\&F), be aware that hidden groups are not available in B\&F. To include the groups in B\&F but exclude them from Financial Statements, create a copy of the statement. In the version used for B\&F, ensure the groups are visible.
{% endhint %}
If you don't want a group or calculation to display on the financial statement, you can hide it from view. This setting allows you to use the item in other calculations but not display it as a row on the statement itself.
Click the eye icon  next to the group or calculation to turn visibility off or back on again.
## Reverse the sign of a group
The **Reverse sign** setting flips the sign of the value. A negative number displays as positive, and a positive number displays as negative.
Select this setting based on how your accounts are structured in your source data. For example, revenue often appears as a negative value in a Trial Balance because it is a credit. In a financial statement, you typically want revenue to display as a positive number.
Select **Reverse sign** to display the revenue value as positive in the statement.
## Make an item bold
To make the item more distinguishable from other rows, select the **Bold** checkbox.
The item name and its values display in bold in the statement. This is typically used for totals, such as Total Revenue or Gross Profit.
## Set variance logic
Use the **Variances** setting to control how values display in the variance column. In combination with the **Styles** > **Red/green % variances** option in the grid, this setting applies color coding so you can see at a glance whether the result is favorable or unfavorable.
* Select **Higher is better** when an increase in the value is a positive outcome. If the value is higher than the comparison period, it displays in green. If the value is lower, it displays in red. For example, revenue is typically better when it is higher than last year.
* Select **Lower is better** when a decrease in the value is a positive outcome. If the value is lower than the comparison period, it displays in green. If the value is higher, it displays in red. For example, cost of goods sold is typically better when it is lower than last year.
## Delete an item
You can delete all item types from the statement. If you delete a group or calculation that's referenced by another calculation item, you will break the formula. You must fix the formula before you can save your changes to the statement.
If you delete a group that has accounts mapped to it, the accounts are moved to the **Suspense** row in the statement.
Click the item's **Delete** button. The group is deleted from the statement immediately.
## Save your changes
When you're finished editing a statement, click **Save** at the bottom of the page to save your changes. Your changes will be applied after the next database build.
See [Exit and rebuild the database](https://docs.phocassoftware.com/financial-statements/managing-statements/manage-financial-statements-beta#exit-and-rebuild-the-database).

 [Add](#add-an-item) a new item (group, calculation, heading, or spacer).
*  [Show or hide](#show-or-hide-an-item) an item in the statement.
* Change the number format for [calculation](#add-a-calculation) results.
* [Reverse sign](#reverse-the-sign-of-a-group) of a group to display a negative number as a positive, or vice versa.
* [Set the style](#set-the-style-of-an-item) of a group or calculation to control how it looks in the statement.
* [Delete](#delete-an-item) the item from the statement.
## Set the revenue row
The **Revenue row** setting is available in Profit and Loss statements only. It's used to drive the **% Revenue** calculation that can be turned on in the statement grid via the **Columns** menu.
Select the correct account group from the dropdown list in the top-right corner.
## Reorder items
Change the order in which the groups, calculations, headings, spacers, and balances (if applicable) appear in the statement.
Click and hold an item’s move button (a blue box displays around the row), then drag the item up or down to its new position. Reorder the other items as required.
{% hint style="success" %}
If you add groups (sub-dimensions) for the accounts in the statement, you can [apply a custom sort order](https://docs.phocassoftware.com/financial-statements/manage-dimension-groups#apply-a-custom-sort-order) for the items in those groups.
{% endhint %}
## Rename an item
Use descriptive names to help users understand the item's contents.
Click in the item's name box and edit the name as required.
## Add an item
The items in a financial statement here appear as rows in the statement grid.
See [Take a tour of Financial Statements](https://docs.phocassoftware.com/financial-statements/getting-started/take-a-tour-of-financial-statements) to learn about the rows in the statement grid.
### Add an account group
The account groups you see here display as grey rows in the statement grid.
{% hint style="info" %}
You can only add account groups in statements based on custom dimensions.
If the statement uses an existing mapping dimension that is shared with another statement, you can’t add, edit, or delete account groups, or remap accounts.
{% endhint %}
If the statement uses a custom dimension, you can add new groups, edit existing groups, and delete groups you no longer need.
For example, suppose your Profit and Loss statement has one Revenue group but you want to view your revenue value split into two categories, Retail and Online. You can add another group of revenue accounts and edit the existing group accordingly.
1. Click the **Add** button where you want to insert the new group and select **Group**.
2. Enter a name for the group.
[Add](#add-an-item) a new item (group, calculation, heading, or spacer).
*  [Show or hide](#show-or-hide-an-item) an item in the statement.
* Change the number format for [calculation](#add-a-calculation) results.
* [Reverse sign](#reverse-the-sign-of-a-group) of a group to display a negative number as a positive, or vice versa.
* [Set the style](#set-the-style-of-an-item) of a group or calculation to control how it looks in the statement.
* [Delete](#delete-an-item) the item from the statement.
## Set the revenue row
The **Revenue row** setting is available in Profit and Loss statements only. It's used to drive the **% Revenue** calculation that can be turned on in the statement grid via the **Columns** menu.
Select the correct account group from the dropdown list in the top-right corner.
## Reorder items
Change the order in which the groups, calculations, headings, spacers, and balances (if applicable) appear in the statement.
Click and hold an item’s move button (a blue box displays around the row), then drag the item up or down to its new position. Reorder the other items as required.
{% hint style="success" %}
If you add groups (sub-dimensions) for the accounts in the statement, you can [apply a custom sort order](https://docs.phocassoftware.com/financial-statements/manage-dimension-groups#apply-a-custom-sort-order) for the items in those groups.
{% endhint %}
## Rename an item
Use descriptive names to help users understand the item's contents.
Click in the item's name box and edit the name as required.
## Add an item
The items in a financial statement here appear as rows in the statement grid.
See [Take a tour of Financial Statements](https://docs.phocassoftware.com/financial-statements/getting-started/take-a-tour-of-financial-statements) to learn about the rows in the statement grid.
### Add an account group
The account groups you see here display as grey rows in the statement grid.
{% hint style="info" %}
You can only add account groups in statements based on custom dimensions.
If the statement uses an existing mapping dimension that is shared with another statement, you can’t add, edit, or delete account groups, or remap accounts.
{% endhint %}
If the statement uses a custom dimension, you can add new groups, edit existing groups, and delete groups you no longer need.
For example, suppose your Profit and Loss statement has one Revenue group but you want to view your revenue value split into two categories, Retail and Online. You can add another group of revenue accounts and edit the existing group accordingly.
1. Click the **Add** button where you want to insert the new group and select **Group**.
2. Enter a name for the group.