
Release notes
Access our product release notes, where you can find information on the new features and changes we've released over the past year.
September 17, 2025: Administration > Profiles
We made several improvements to the Administration module. This release introduces the modern UI used across other modules and lays the groundwork for upcoming features. It is already live on most Phocas sites and will be available to all sites within the next few days.
User account page > Profile tab
We changed how the Profile tab on the user account page works. This tab now shows a read-only view of the legacy profile, with an Edit button that opens the profile page, where you can update the underlying user permissions as usual. You can still create user-specific profiles from here.

Main Profiles page
We redesigned the Profiles page to give you clearer profile types, easier filtering, and more flexible ways to manage profiles. The design is more intuitive, modern, and consistent with other parts of Phocas.
As part of this change, we now refer to default or shared profiles as organization profiles.

Individual profile pages
We also redesigned the profile page (where you edit a profile; accessible from the main Profiles page or the Profiles tab of the user account page).
A notable change on this page is you can no longer copy a profile from another user directly from the Profile tab. You can still copy a profile, but the process is different: First clone it on the Profiles page to convert it into an organization profile, then assign that profile to the user from the Profile tab.

September 16, 2025: Insights (version 25.9.4)
You can now export your customer segmentation data as a CSV file for analysis in external tools or sharing with colleagues.

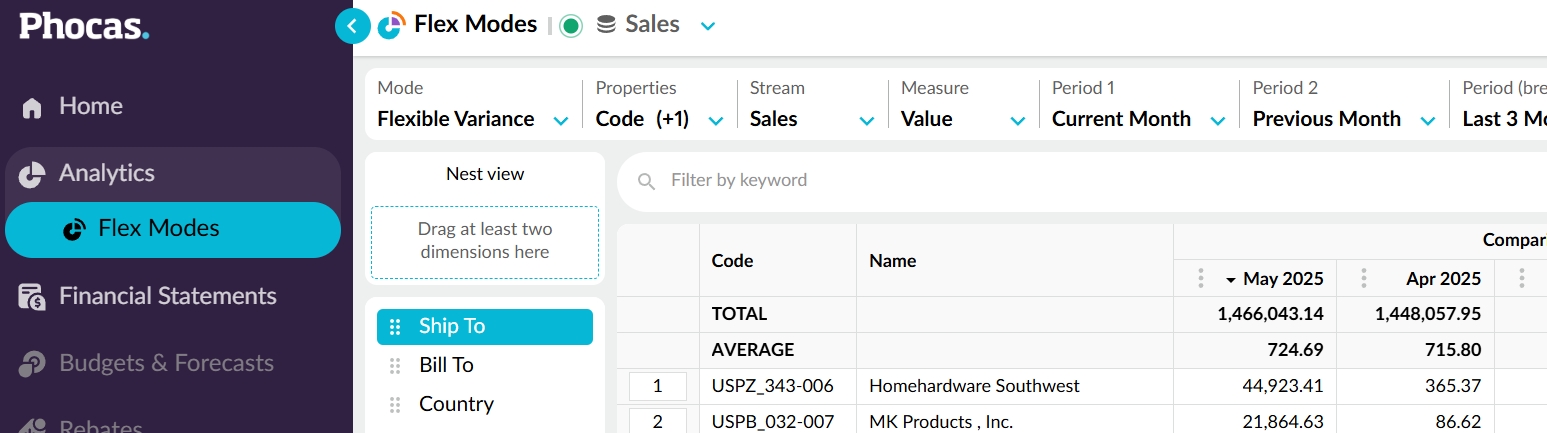
September 15, 2025: Analytics > Flex Modes (version 25.9.4)
Dynamic dates in custom periods
You can now apply dynamic date ranges (like Last 7 days, Month to date, Year to date) in addition to fixed dates. Dynamic date ranges automatically update based on today’s date, so you always see the latest period. More dynamic options are coming soon.

Advanced filter enhancements
When you click Clear all filters in the Advanced filter pane and then click Close, you’ll now get a prompt to either Close without saving or Keep editing. This change prevents you from accidentally losing filters and lets you confirm changes before applying them.
We moved the Advanced search button from the filter bar into the toolbar with the other icon buttons. This makes it easier to switch between panels and improves consistency.
September 11, 2025: Financial Statements & Dashboards (version 25.8.21)
When editing dashboards, you can now use Analytics mode to update a Financial Statements widget query. Previously, editing a dashboard widget based on a financial database would cause an error if you clicked a dimension in the statement to switch into Analytics. This fix lets you seamlessly move between Financial Statements and Analytics, so you can refine your queries without interruption.

We also fixed an issue that occurred when you changed the stream while working with chart configuration options. Previously, this resulted in an error, but now the chart updates correctly.
September 11, 2025: Administration > Designer (version 25.8.21)
We updated the version history to focus on meaningful changes. By default, automatic repair entries are hidden. If you need to see them, click Show automatic design changes. This change allows you to scan the true change history faster, without noise from background system repairs.

September 8, 2025: Budgets & Forecasts (version 25.8.21)
Today we released the first set of changes to the Period tab in workbook setup. These changes aim to make setup simpler and more flexible by organizing the settings in a logical, step-by-step order (like building blocks) so it's easier to understand and configure to meet your budgeting needs.
This release includes renamed and repositioned settings, along with other improvements, as illustrated below. You will see the changes in your Phocas site tomorrow.

In the next release, you'll be able to add rows and baseline values from other streams and periods.
September 3, 2025: General news (version 25.8.15)
Following on from our July release, you can now bulk delete items you own (favorites, dashboards, and alerts) directly from your homepage.
When you delete items, they move to the Deleted items tab, where they remain recoverable for 45 days before being permanently removed. A pink dot on the Deleted items tab notifies you of the change. If you select items you don’t own, or items that can't be deleted from the homepage (such as databases), you’ll be notified, and those items will remain selected.
This update makes it quicker and easier to remove multiple items at once and is the first of several new bulk actions coming soon.

August 26, 2025: Administration > Designer (version 25.8.10)
We added color coding to Designer to make it easier to distinguish the database design elements. Dimensions are blue, properties are yellow, measures are pink, and the date is purple. Unmapped items appear in grey, so you can quickly identify mapped items and work more easily in Designer.

August 26, 2025: Analytics (version 25.8.10)
New chart configuration option
We added a new Smart formatting option to the configuration of Gauge, Summary, and Ring Summary charts.
When selected, smart formatting removes decimal places and automatically abbreviates large values, making numbers easier to read. This is especially useful when adding such charts to dashboards; you can show cleaner, bolder numbers while still conveying the same information.

Updated gauge dial icon
We updated the icon displayed on gauge charts. This makes the dial less obtrusive and gives the gauge a sharper, more modern look.
August 26, 2025: Budgets & Forecasts (version 25.8.10)
New publishing option
When publishing a budget to an existing stream, if that budget has dimension filters applied, you’ll now see a new checkbox: Delete all existing records from the published stream that match the budget period.

Selecting this checkbox removes all rows from the target stream before publishing the filtered budget, which prevents old, filtered-out values from remaining in the stream when you re-publish with different filters. It also makes it easier to manage multiple filtered budgets publishing to the same stream, without needing to create separate streams.
Performance improvements
The process of publishing budgets by days now uses memory more efficiently, reducing the chance of hitting browser limits and making large publishes more reliable.
August 20, 2025: Analytics > Flex Modes (version 25.8.5)
You can now press the F key while working in the grid to focus on the current row selection. This shortcut makes it quicker to drill down into your data.

August 19, 2025: Navigation (version 25.8.5)
In your Phocas navigation menu, the Resource Centre has been renamed to Help and support to better reflect its contents: guided tours, videos, documentation, news, and support. This change makes it easier for you to identify where to go when you need learning resources or assistance.

August 18, 2025: Analytics > Insights (version 25.8.5)
We’re delighted to announce the release of Insights, a new add-on to the Analytics module. The initial release introduces the Customer Segmentation tool, which leverages your sales data to group customers by behavior and uncover opportunities for growth and retention.
If you’re interested in using Insights, please contact your Customer Success consultant.

August 15, 2025: Financial Statements (version 25.8.1)
If you open Financial Statements and think, “Hmm… it looks different,” you’d be right! We’ve just released a fabulous new glow-up.
The updated design aligns with the Flex Modes interface, giving you a modern, unified look across those pages. All functionality remains the same, so you can continue working as normal.

August 13, 2025: Financial Statements (version 25.8.1)
Financial Statements now has its own home page, giving you a quicker way to access your financial content. Use the handy tabs to view all your financial databases, statements and favorites in one place. Stay focused on your financial work without distraction from unrelated items!

August 11, 2025: Analytics > Flex Modes (version 25.8.1)
Transaction view enhancement
On the Transaction view tab, transactions are now grouped by your selected dimension, making it easier to review and compare related transactions in context. For example, you can quickly see all transactions associated with a specific sales rep, customer or product. Expand a dimension entity row to view its transactions nested underneath.

Default mode
The default mode is now Flexible Period instead of Flexible Variance. This change simplifies your experience when opening Flex Modes by making the most commonly used option the default.

August 11, 2025: Budgets & Forecasts (version 25.8.1)
You can no longer make structural changes to a budget or forecast workbook if it includes any of these linked worksheet tabs: Database, Lookup, Headcount, Reference, Balance Sheet, or Allocations. This restriction prevents accidental data loss and broken links between tabs.
When a linked tab is present, key setup options are locked, including:
Database (and Statement in financial budgets)
Period type (but not the period itself)
Baseline stream
Budget owners can unlock these settings by:
Deleting all linked tabs.
Using the new Structural settings switch in the setup. This temporarily allows editing, but after saving changes, the setup automatically locks again.
This update helps protect your budgets and forecasts by ensuring your data and links remain intact. It also reduces the need for workbook restores.

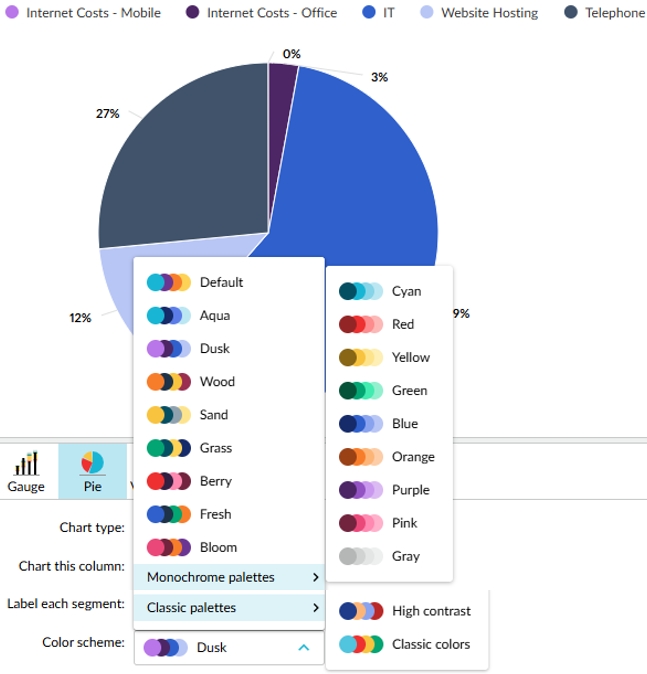
August 6, 2025: Dashboards (version 25.7.22)
Dashboards now use new color palettes, with default colors based on Phocas branding. This improves consistency and accessibility. Soon, you'll be able to customize dashboard colors.

Chart widgets that use traffic light-style colors (such as gauges) are not affected.

August 6, 2025: Analytics > Flex Modes (version 25.7.22)
Resizable dimension panel You can now resize the Dimension panel by dragging its border. The panel width is saved locally, so your preference stays in place. This gives you more control over how much space is available for viewing dimension names of varying lengths.

Custom number format in transactions You can now format the values in the Transaction view tab. Click the new kebab menu in the value column header, then click Number format and select your preferred format. This gives you more control over how your data is displayed.

More functions for calculations
You can now select the AND, IF, NOT, and OR functions directly from the insert function dropdown when creating a calculation column. These functions were already supported but are now easier to access.

July 23, 2025: Analytics > Flex Modes (version 25.7.12)
New Reset button
We added a Reset button to let you quickly restore your workspace to its original state. This is useful if you want to stop your current analysis and quickly start again. As part of this update, we also moved and updated the Focus button.

New Exclude and Focus options in the right-click menu
We added Exclude and Focus options to the context menu that opens when you right-click selected cells or rows in the grid. These options let you quickly filter your analysis without using the toolbar.
Focus works the same as the Focus button, filtering the view to show only the selected records.
Exclude removes the selected records from the grid.
Your filter result displays as a chip on the right of the filter bar and is included when you save a favorite. This feature is also available in the Analytics, so it will feel familiar to long-time users.

The Exclude option is now also available in the advanced filter.

Custom columns enhancements
We've made it easier to exit or cancel the creation of measure and calculation columns. Previously, the column definition settings remained on screen, and it wasn’t clear how to back out of the process. Now when you change the definition of a measure column or the formula of a calculation column, you can:
Press Enter to save or Escape to cancel.
Use the new Save and Cancel buttons in the transaction column toolbar.
These changes create a more intuitive experience when working with custom columns.

Following the June release, where we introduced the ability to change the period in a measure column definition, you can now take it a step further and select a custom date range. This gives you more flexibility when defining the timeframe for the data in that column.

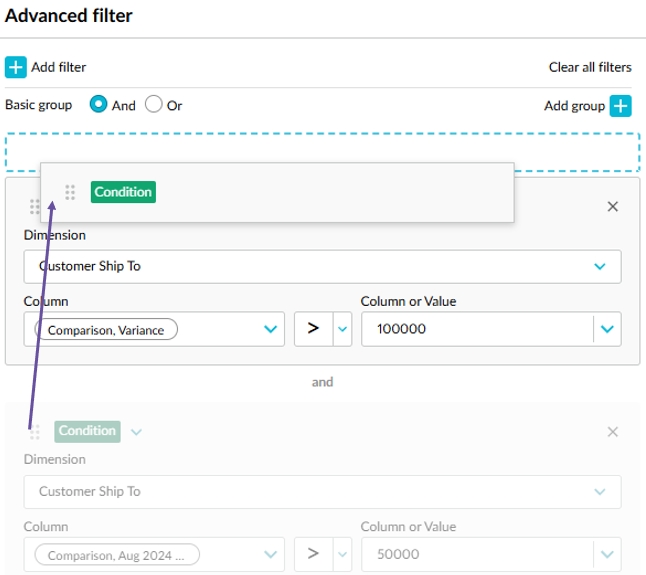
July 16, 2025: Analytics > Flex Modes (version 25.7.5)
In Flex Modes, we updated the drag and drop interface in the Nest view box and Advanced filter panel. The drop zones are now larger and more intuitive, with a blue border to make them easier to see. This makes it easier for you to create a nested view, and reorder filters and groups when creating an advanced filter. This update improves usability and helps you work faster when building or adjusting your analysis.
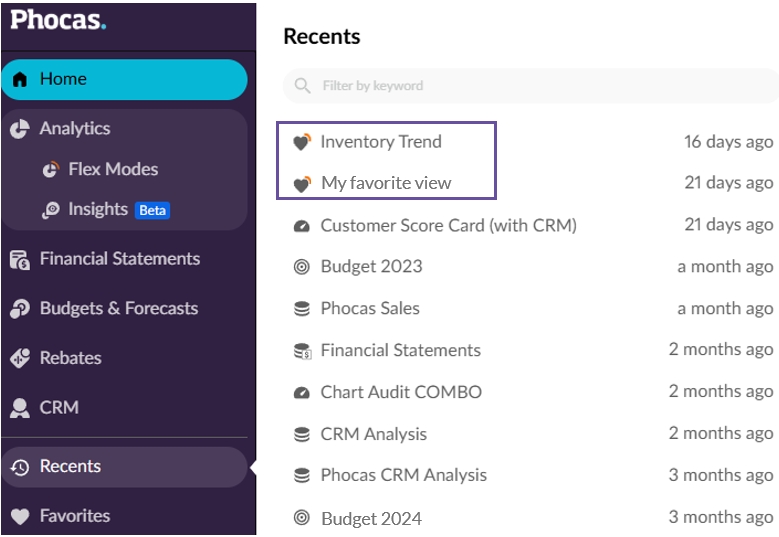
You can now access your Flex mode favorites from the Recents menu in the side navigation. This gives you another quick way to open your frequently used content.
July 15, 2025: General news (Version 25.7.5)
You can now recover deleted dashboards, favorites, and alerts from the new Deleted items tab on your homepage. Deleted items remain available for 45 days before being permanently removed. If a user is deleted, an administrator can recover that user’s items during the same 45-day window.This new feature gives you more control over your content and removes the need to contact support if you accidentally delete something.
This new feature gives you more control over your content and removes the need to contact support if you accidentally delete something.

July 7, 2025: Analytics > Flex Modes (version 25.6.24)
In Flex Modes, conditional formatting rules can now be applied to matrix views. You can define different rules for the grid and matrix view, giving you the flexibility to create separate visual cues that suit each one. All your rules are included when you save a favorite, making it easy to retain your personalized formatting for future analysis.
June 30, 2025: Analytics (version 25.6.16)
Analytics
We made some fresh UI changes to dashboards, giving them a more modern look. Watch out for more dashboard-related changes coming soon.
Flex Modes
In measure columns that you add to the grid, you can now change the period. Previously, you could only change the stream and measure. This addition lets you look at data from different date ranges, giving you even more flexibility when it comes to your analysis. Your selected period works with filters, conditional formatting, and chart builder. It's also included when you save a favorite. Currently, you can select from the list of defined periods. We hope to add the ability to select a custom date range soon.
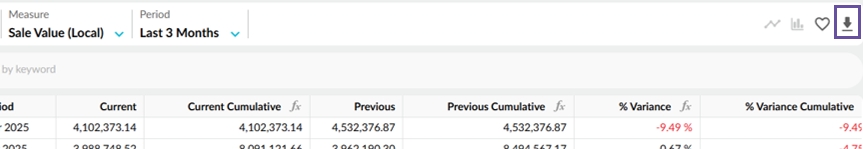
We began the process of releasing a new export feature; you should see the new Export button in your toolbar soon. It allows you to export your data as a CSV file for analysis in external tools or sharing with colleagues.
June 25, 2025: Analytics > Flex Modes (version 25.6.13)
You can now select a custom period that's made up of day and year period types. Previously, custom date selections were only available for the month period type.
Now when you add a measure column, the column definition settings open automatically for you, so you can quickly define the data in that column.
Now when you save a favorite, any column sorting or matrix configuration you've applied will be included in that favorite.
June 13, 2025: Financial Statements (version 25.05.25)
Financial Statements
The release of the Combined streams feature we started rolling out last month is now complete.
Budgets & Forecasts
Session filters: Session filters are no longer limited to the Main tab; you can now apply them to Database and Reference tabs too. This enhancement allows you to filter large sales driver tabs before opening them, leading to improved performance. It might also reduce the need to split budgets up, as you have more precise control over what's being worked on at any given time.
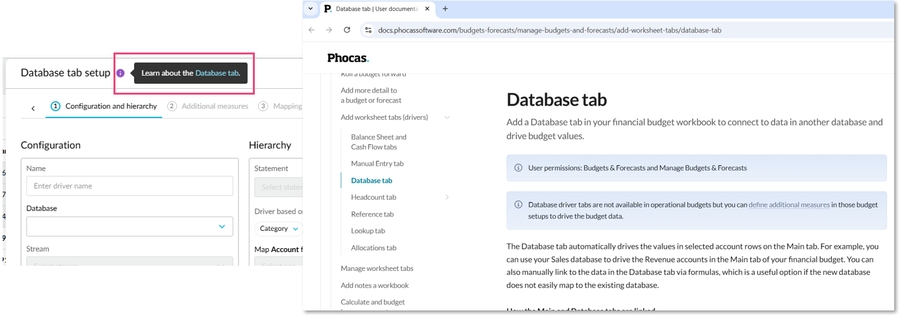
Database tab: We added a new option to the Database tab setup that allows you to quickly map all entities in a dimension to one target entity or account in the Main tab. For example, you might want all sales rep values to drive the one sales account. This improvement simplifies and speeds up the setup of the database driver, especially when a many-to-one mapping is needed. It also future proofs your driver because new or previously inactive entities are now automatically mapped to the Main tab.
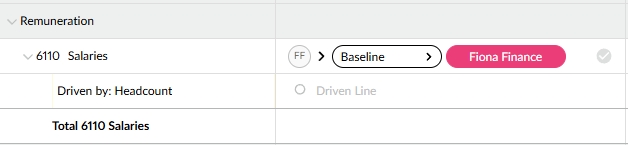
Headcount-related workflows: The workflow is now active for rows in the Main tab that are driven by the Headcount tab, behaving just like any other row. Previously, the workflow was locked in the driven status, meaning those rows couldn't be assigned to another user. As a result, only the user who originally owned the workflow could interact with the driven rows (such as add or edit sum lines), preventing other users from collaborating on adjustments. This change increases flexibility and collaboration in budgeting workflows by allowing you to manage and refine driven accounts more freely.
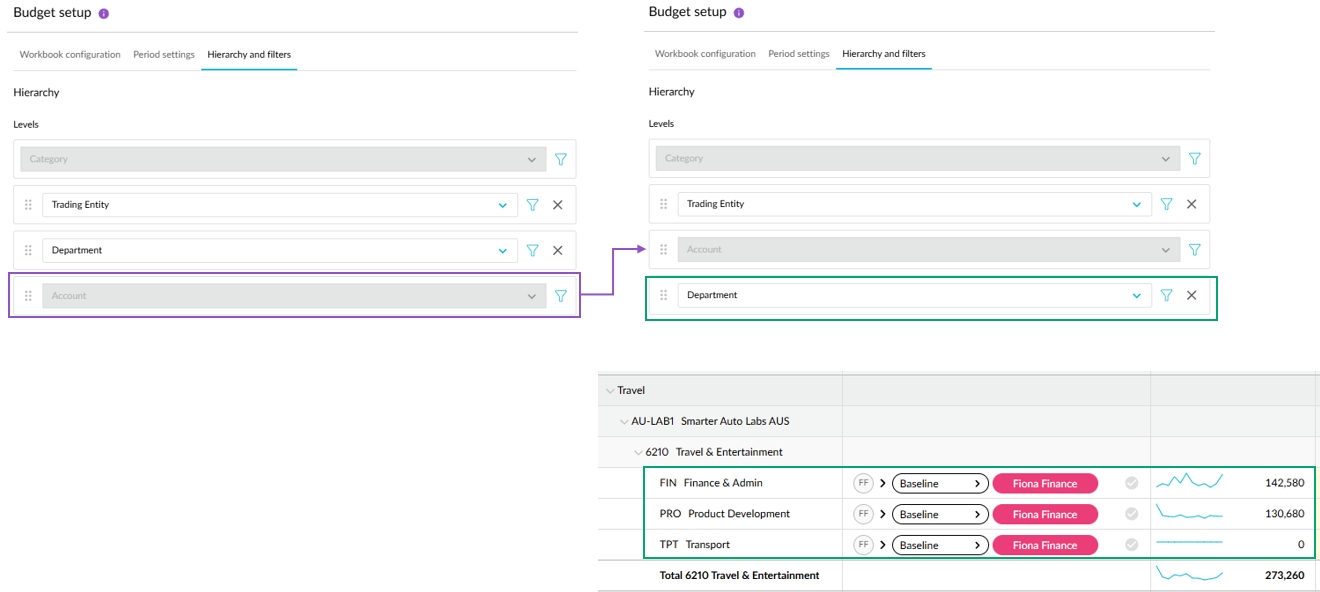
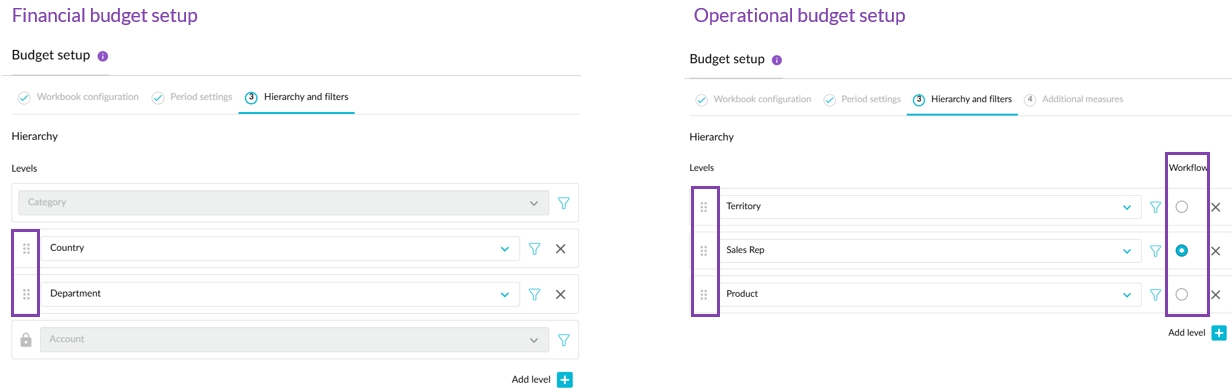
Budget hierarchy enhancement: Last November, we released a budget hierarchy enhancement that included the ability to reorder levels and determine the workflow level in operational budgets. This enhancement is now available for financial budgets, which means you can have dimensions below the Account dimension. For financial budgets, the workflow continues to sit at the lowest level as changing this would cause problems with driven rows. This improvement gives you more flexibility when it comes to setting up your budget.
May 28, 2025: Financial Statements (version 25.5.13)
Today we began the process of releasing a new Combined streams feature that allows you to manage streams and scenarios directly within Financial Statements. You should see this change in your site soon. This feature brings the following changes:
The Current and Budget menus are combined into one Streams menu.
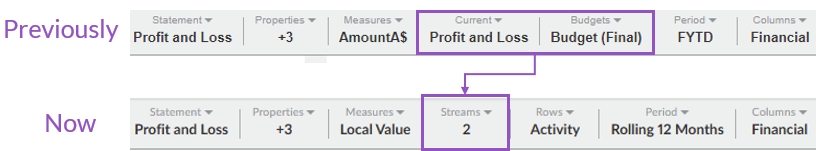
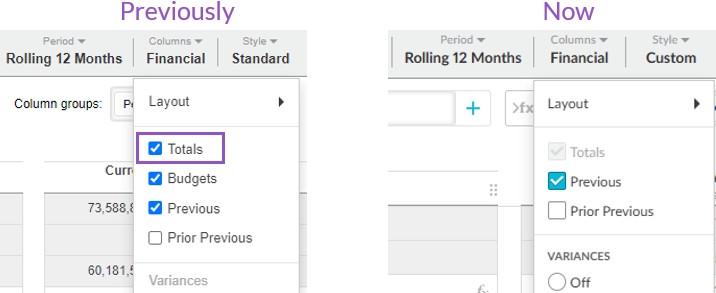
The Budgets option is removed from the Columns menu. You now add budget columns via the new Streams menu.
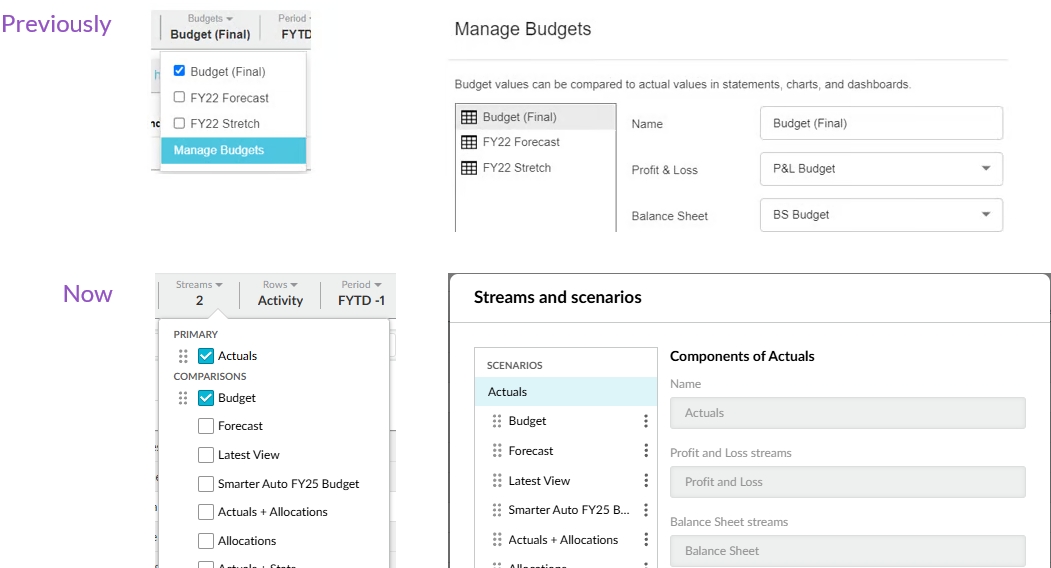
The Manage budgets feature is replaced with the Manage your streams and scenarios feature, which you access this via the new Streams menu.
May 21, 2025: Budgets & Forecasts (version 25.4.21)
Levels as tabs: You can now switch between a hierarchical level view and a new tab-based layout of the dimension levels in a budget. When the budget for each dimension level entity is on a separate tab, you can clearly focus on one entity at a time and easily jump between them without scrolling or expanding nested views.
Flat View: This new view transforms the usual hierarchical (nested) layout of the data into a tabular format, where the dimension levels become columns. This view lets you focus purely on data entry with minimal layout overhead, maximizing data entry efficiency.
Ability to hide dimension columns: When in the flat view, you can choose to hide or show the dimension columns to further optimize space usage, where you can see more cells with less scrolling.
May 20, 2025: Analytics (version 25.4.21)
The Flexible Variance (Beta) program in Analytics has now ended. It’s been replaced by the Flex Modes module. You’ll no longer see the Industry modes item in the Mode menu in Analytics. Instead, you’ll see a new Flex Modes item in your side navigation menu, underneath Analytics.
Today we began the process of releasing the Flex Modes module to each Phocas site. You should see this new module in your side navigation menu soon.
Flex Modes is an extension of Analytics. You can continue to use Analytics just as you always have, but now you have a new, more flexible way to explore your data.
Read the user documentation here.
Visit our website to learn more about this new module.
May 12, 2025: Budgets & Forecasts (version 25.4.21)
Dimension entity filters:
You can now apply multiple dimension entity filters to a worksheet within a budget workbook. Previously, only one such filter was allowed per tab.
Dimension entity filters are useful when you want to restrict the workbook to one entity within a dimension but you don't want to add another level to the dimension hierarchy. The result is a simpler, more focused view of the data.
To support this change, we added a new user documentation page that summarizes and compares the different filtering methods, helping you to select the best one for your budgeting scenario.
Budget – Actual mode in forecasts:
You can now get an alternative view of the traditional Actual + Budget mode in the total column area. The Budget – Actual mode is helpful for understanding how much of the budget is left after subtracting the year-to-date spend.
We see this view being used by budget holders when making decisions around prioritizing spend in later months in the budgeting cycle. This view may also appeal to financial controllers as a tool to help control costs.
Multiple currencies in the Cash Flow:
We changed the way the Cash flow forecast handles multiple currencies. Previously, when budgets were entered in reporting currency, cash movement was calculated using translated values rather than the actual local currency movement. This led to artificial cash flow fluctuations, caused by changing exchange rates rather than cash movement.
Now, the cash movement is calculated based on local currency movement, and then appropriately translated. Any exchange rate-driven differences are recorded in a dedicated Foreign currency translation adjustment line.
This change addresses a use case where customers budget directly in reporting currency. It also aligns the Budgets & Forecasts Cash Flow statement with those in Financial Statements, ensuring accurate reporting.
April 29, 2025: Administration (version 25.4.10)
We released the Impersonate feature, which allows you to impersonate (act as) another Phocas user in your organization. This feature is very useful when you need to check the settings or troubleshoot issues in a user account.
April 24, 2025: Financial Statements (version 25.4.10)
We have reduced the size of financial databases and made other enhancements, which has led to an average of 40% performance improvement in build times.
March 28, 2025: Financial Statements (version 25.3.4)
You can now update the Balance Sheet Retained Earnings account to which the Profit and Loss transactions are mapped. You can also choose to distribute the P&L transactions across multiple Retained Earnings accounts.
A new Data Entry permission has been added to Financial Statements section of the Profile tab on the user maintenance form. While this permission doesn’t allow any new functionality yet, it will soon allow you to enter data (such as intercompany journals) directly into Financial Statements. This update is part of upcoming enhancements to make Financial Statements more interactive and flexible. Stay tuned for more details in a future release
March 20, 2025: Financial Statements (version 25.2.14)
To improve stability in custom layouts, favorites, and dashboards, we’re migrating the names of items (such as budgets, measures and periods) to unique backend IDs.
Most items will migrate as expected and you won't notice any changes. However, some older items might not migrate correctly. If you notice any broken items, try editing and saving them to ensure they update with their new ID.
March 14, 2025: Financial Statements (version 25.2.14)
We added new color palettes to charts and updated the classic palette. Any existing charts on your dashboards will not change.
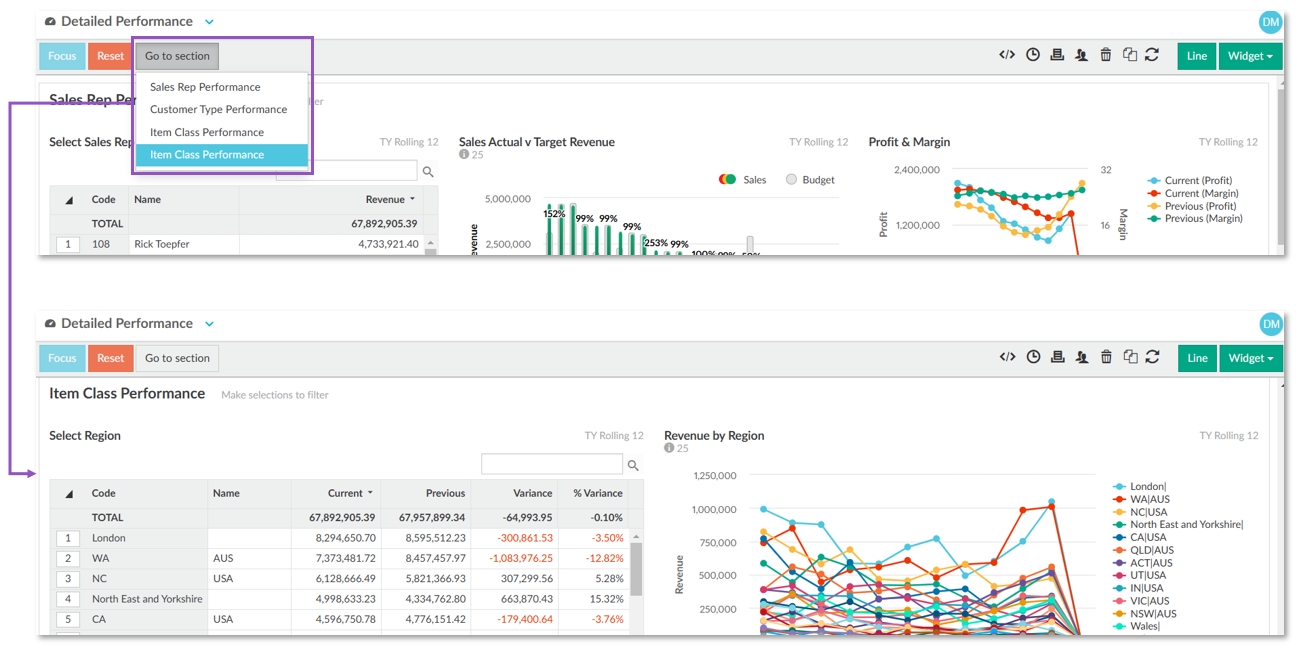
March 7, 2025: Analytics (version 25.2.5)
On dashboards, we added a button to the top that allows you to jump directly to a section (line) on the dashboard. This is a handy navigation tool when you have a large dashboard with multiple lines of widgets, as you no longer have to scroll down through the dashboard to get to the widget you want to see.
In Flexible Variance (Beta) mode, you can now add a chart to the Chart view tab. We also made the following changes to the toolbar:
We added a Save as favorite button (heart icon) to give you a quicker to save your favorite analysis results.
We converted the Sparklines menu into a button (blue line icon), so you can now turn the sparklines on or off with one click. For better context, the sparklines now sit within the Total column rather than in a separate column.

February 26, 2025: Administration (version 25.2.5)
We changed the Sync application so that from today the only available version for download is the new self-updating version. The next time you open Sync, you'll get a message to update to this version, but after that, you'll never need to install another version again. We also made some small changes to the installation process:
You no longer need to select which version (32-bit or 64-bit) of the installer file you want to download. Now, there's only one installer file, and when you run the install wizard, you can select the required version. We also introduced backend checks to ensure you can't install the 64-bit onto a 32-bit operating system, and on 64-bit systems, 64-bit is selected by default.
The Terms and Conditions section was removed from the install wizard, as it isn't required.
Previously, when installing the application, some anti-virus or malware software would warn you that it might be risky. As it isn't risky software, we now ensure the new version is signed, so you no longer get the warning message.
A new Windows scheduled task is now created during the installation process. This task runs hourly and wakes up to check if Sync needs to be updated. This task is required to ensure Sync automatically updates itself. If you remove the task, Sync will no longer update, but you can fix this by reinstalling Sync updater manually. This is different from the scheduled task you create to run the sync on your files.
January 27, 2025: Analytics (version 25.1.2)
In Flexible Variance (Beta) mode:
We introduced the Transaction view tab that displays the underlying transactions for the data currently displayed in the grid.
We introduced the Matrix tool that allows you to filter and pivot selected data into a matrix format.
We added the Count option in the Measures menu that corresponds to the dimensions in the database. This is also available in measure columns, providing greater flexibility when it comes to determining the data that is displayed in the grid.
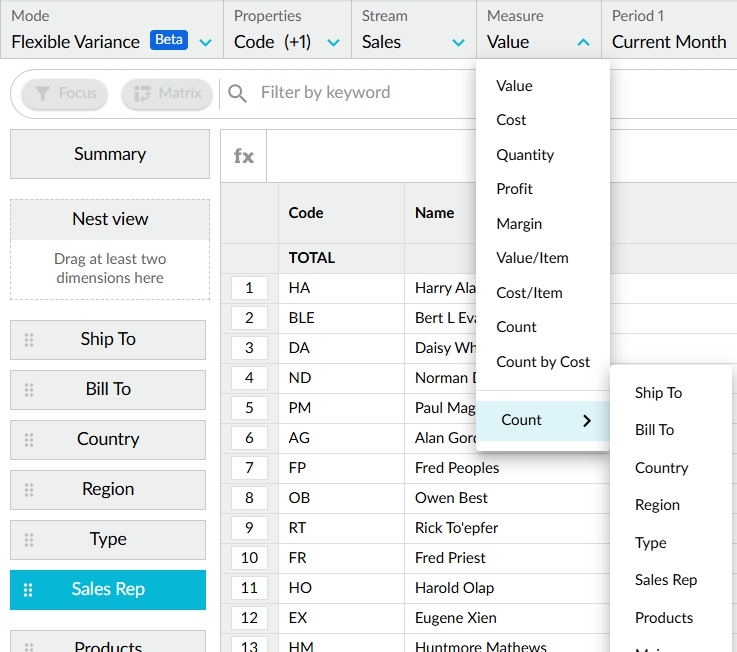
We improved the row selection functionality. When focusing on rows, you're no longer restricted to selecting adjacent rows; you can now select a batch of rows that aren't next to each other.
January 15, 2025: Budgets & Forecasts (version 3.12)
Updates for all users:
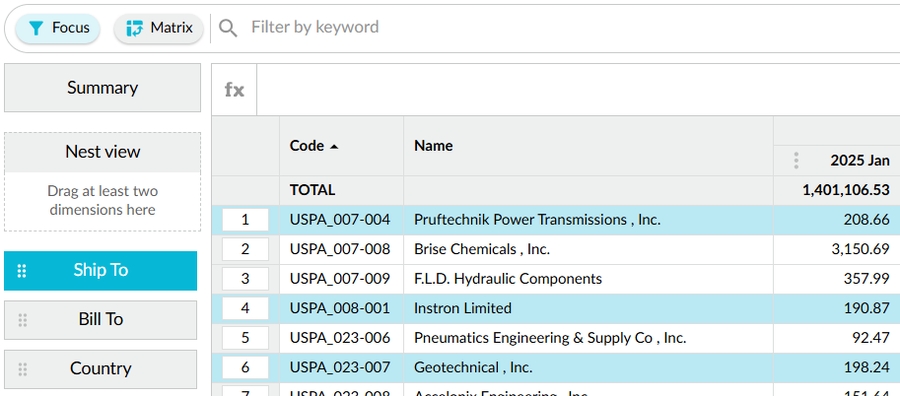
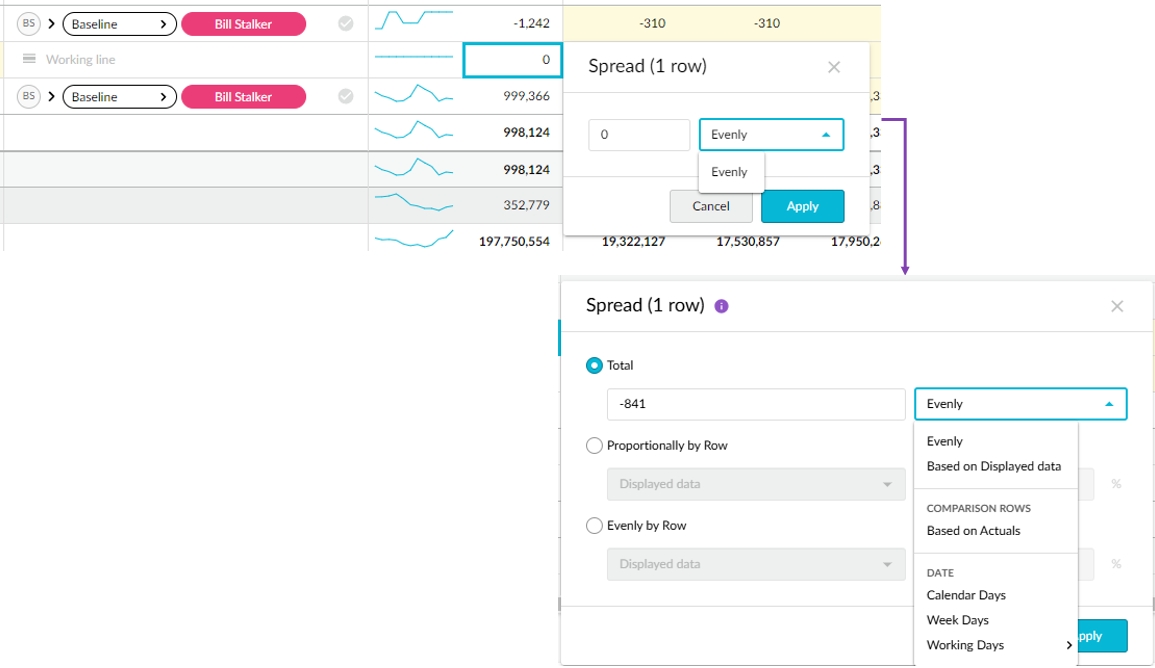
Working and sum line enhancement: We added more spread options to working and sum lines. Previously, you could only spread evenly in these lines. The additional spread options will help you complete your data entry quicker in these lines.
Dimension filter enhancements:
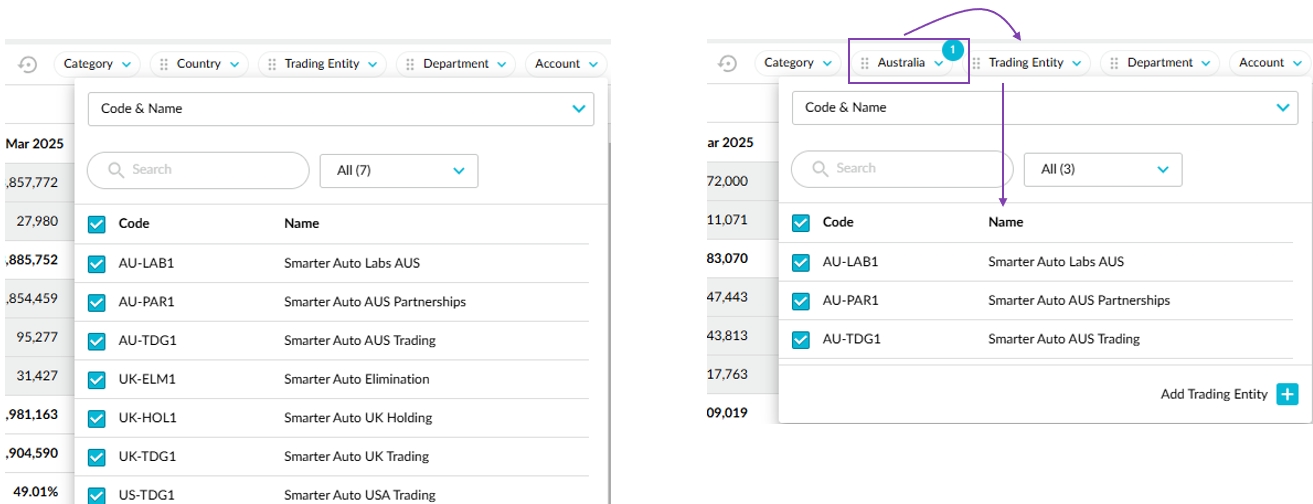
When a budget has multiple dimension levels, and you apply a filter to one of them, the other dimension levels now dynamically update according to that applied filter. For example, if you operate in three countries and have no filters applied, you'll see all the trading entities listed in the Trading Entity dimension, but if you filter the Country dimension to see the budget for Australia only, then go to filter the Trading Entity dimension, you'll only see the Australian trading entities in the list.
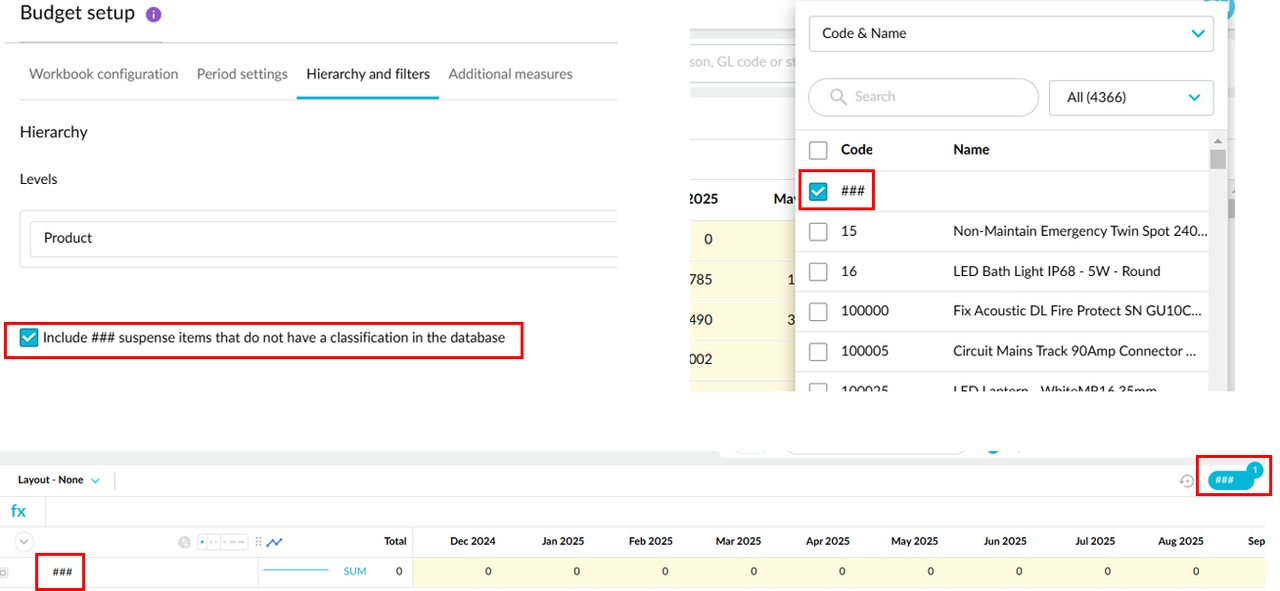
When the Include ### suspense items... setting is selected in the workbook setup, ### is now available as a dimension-level filter, so you can quickly include or exclude those items in the budget or forecast grid.
Other small changes:
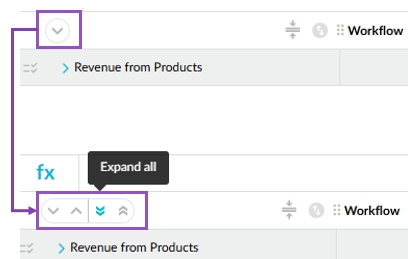
The expand/collapse buttons are now grouped together to save space. Click the button on the top-left of the grid to display the expand and collapse options.
We changed some of the icons in the top-right toolbar to match those in other modules.
Updates for budget owners and administrators:
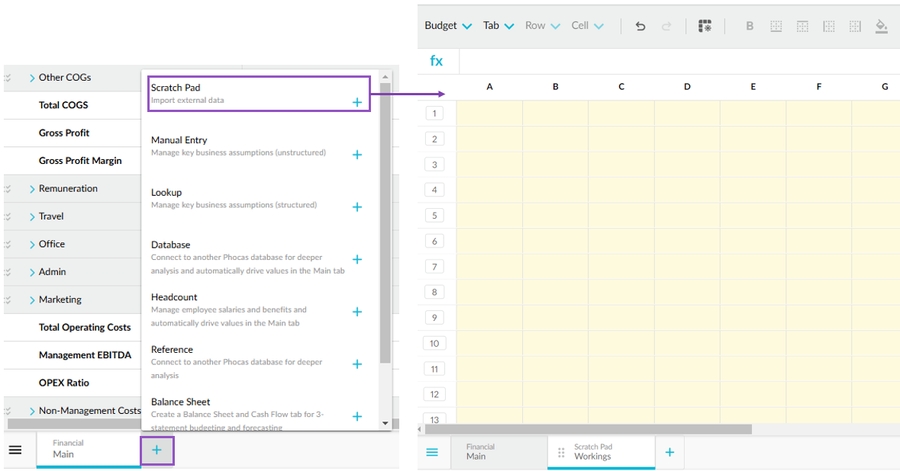
Scratch Pad tab: We added a new type of worksheet tab that supplements the Manual Entry and Lookup tabs. The Scratch Pad tab offers more flexibility, as it's totally unstructured and allows you to import data from Microsoft Excel to drive values in the other tabs.
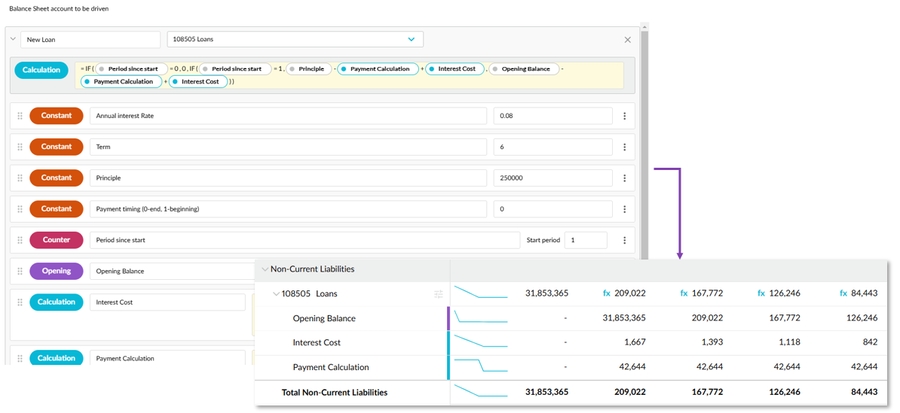
Loan mini drivers: We added two new types of mini driver templates for the Balance Sheet. The loan (amortization) mini drivers allow you to calculate interest payments and principal values for loans.
Category dimension: In financial budgets, we replaced the Add category button with a link that takes you straight to the user documentation page that explains how to add a new account group (category) to a budget.
January 10, 2025 (Version 24.12.16)
Analytics
We're continuing work on the Flexible Variance (Beta) mode that we released in August. The following enhancements are now available:
Advanced search: Previously, this panel only showed the filters you applied using the three other filtering methods. Now, you can initiate an advanced search from here. Click the Add filter button at the top, then select one of the filtering methods, and proceed to set the conditions.
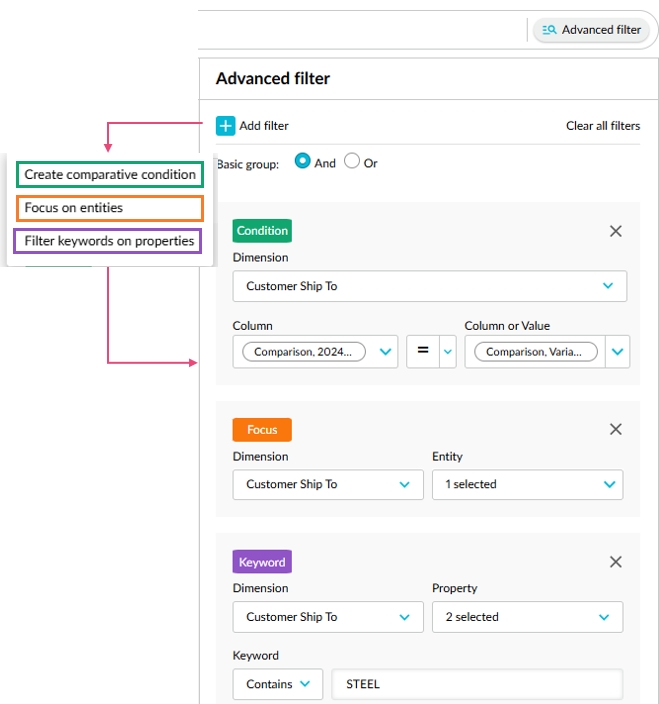
Chart builder: You can now visualize the data of a column in a chart.
Chart view tab: We introduced another tab at the bottom of the screen containing pre-built charts that reflect the data displayed in the grid. These charts update according to the filters you apply to the grid.
Other small changes:
You can reorder columns in the grid.
We removed the Summary button from this mode, as it is not required.
Financial Statements
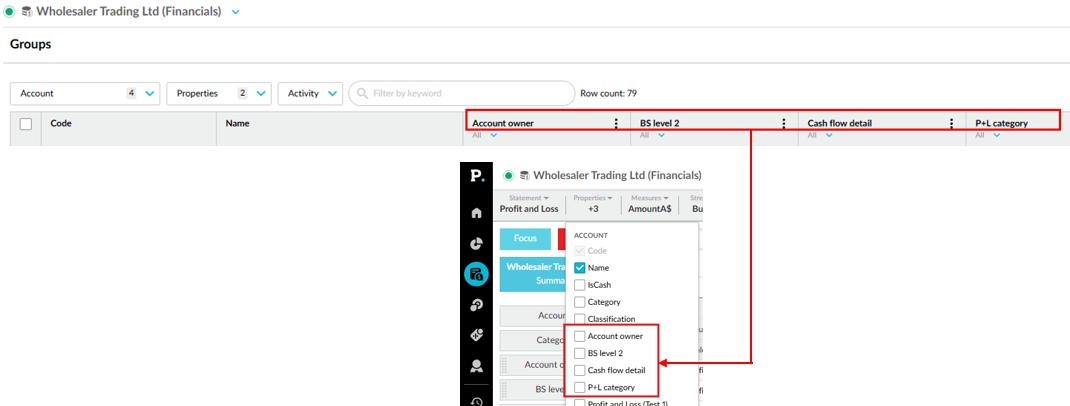
Groups enhancement: We added the account sub-dimension (group) names to the account properties.
December 11, 2024: Financial Statements (version 24.11.18)
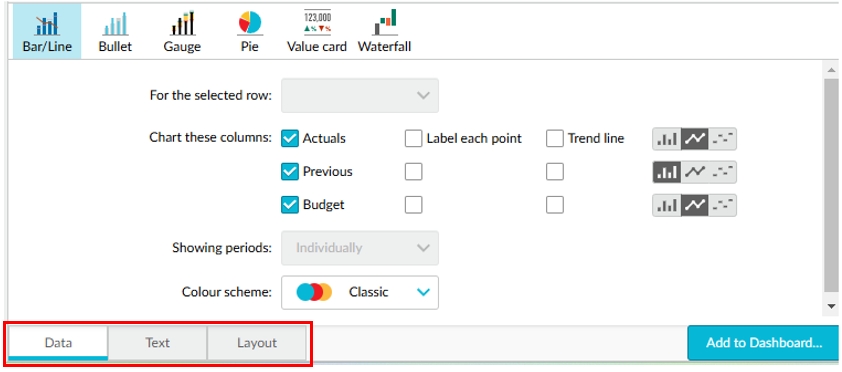
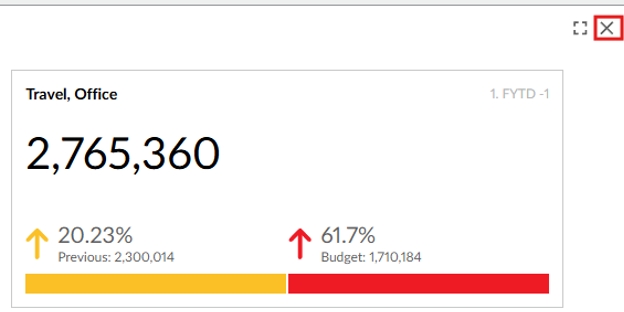
We made two enhancements to charts:
We moved the settings tabs from the left side to the bottom to free up space and pave the way for a new design of the Chart Builder feature.
We added a Close button to the top-right of the chart pane to provide a more obvious way to close the pane (you can still close it via the Chart button in the toolbar).
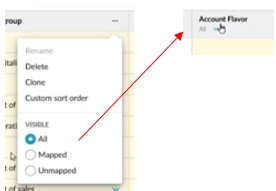
In the Groups window, we changed the way you filter items in the grid to make it easier for you to find and map items. We removed the Visible mapping filter options from the column header menu and replaced them with a filter below the column header label. When you open the new filter, you get a list of all available items and an additional item called (Unmapped). Like how you filter for blank cells in Microsoft Excel, when you select the (Unmapped) item, you get a list of all unmapped items (empty cells). It also has a search box you can use to filter the list of items by a keyword.
December 11, 2024: General news (Version 24.11.18)
Homepage enhancements
Now when you apply one or more filters and sort orders to the grid on your homepage, your selections are retained. This means the next time you view your homepage, it'll look exactly as you left it. This effectively lets you set up your homepage to always display only the items you're interested in.
In addition:
We introduced a Clear filters option to simultaneously clear all the filters you've applied.
We changed the filtering behavior, so fewer clicks are required to get the results you're looking for. Now if no options are selected, this is equivalent to all options being selected.
We changed the style of the tab filter buttons above the grid to make them easier to see.
We now display the description of items in the grid, where available, so you can quickly determine their contents.
New navigation now turned on for all users
In September 2023, we launched a new navigation menu on the left side of Phocas. Recently, we identified that some users were still using the old navigation method, so we migrated them to the new navigation today. If you’re one of those users, you’ll notice the visual difference. The new navigation brings the following benefits:
Easier movement between the different Phocas products and sections.
Resource Centre: Easy access to in-product help and news, new user documentation site, and other learning resources. The old navigation pointed to the old user documentation site, which is no longer being updated.
Upgrades and service request form: Quick way to contact us about making additions to your site.
Product feedback form: Tell the development team what you like about Phocas.
November 28, 2024: Financial Statements (version 24.11.5)
Financial Statements
On 03 September, 2024 (Version 24.8.1) we began the process of migrating each organization’s account mapping feature to dimension groups. The first phase, which involved migrating the creation and mapping of account sub-dimensions, is now complete. This means all organizations now perform these sub-dimension tasks in the Groups window. See the previous release note or the Create sub-dimensions for accounts page for more information.
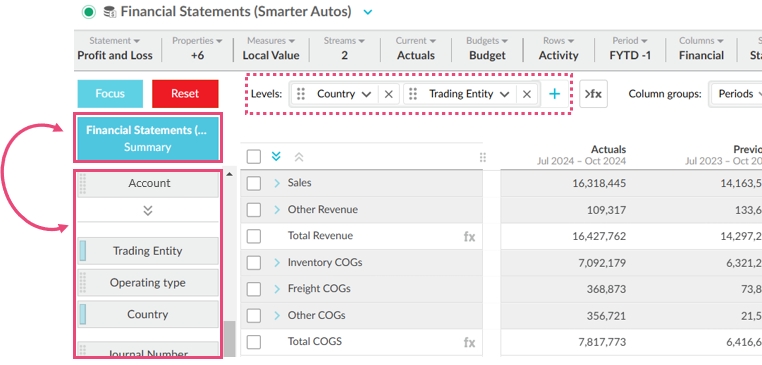
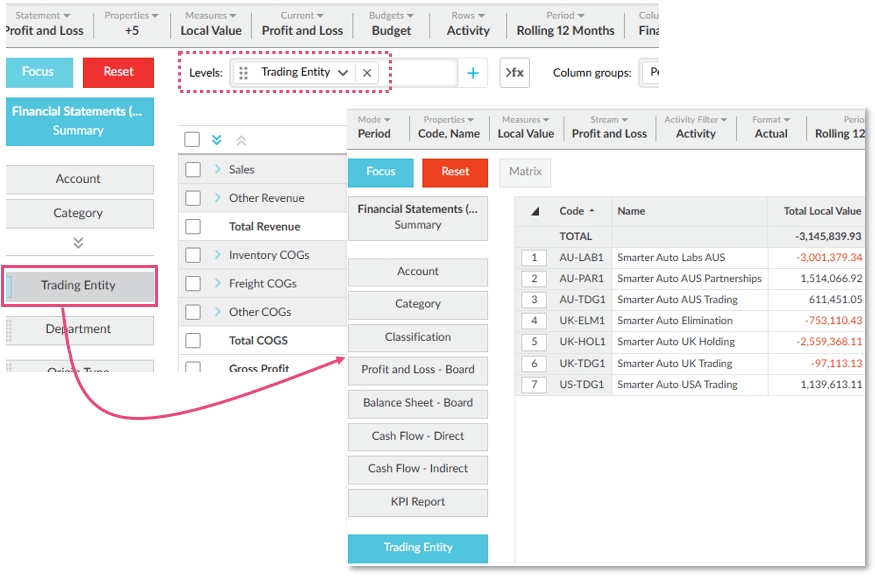
Now when you add a dimension as a level in a statement, then move into Analytics (by either clicking on a dimension or selecting and focusing on items), when you return to Financial Statements, the level persists in the statement. Previously, the level was forgotten, so you had to add it again.
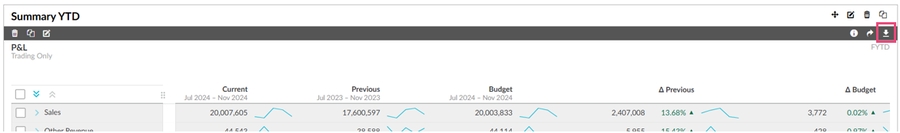
Users with the Export permission can now export financial statements directly from a dashboard.
Rebates
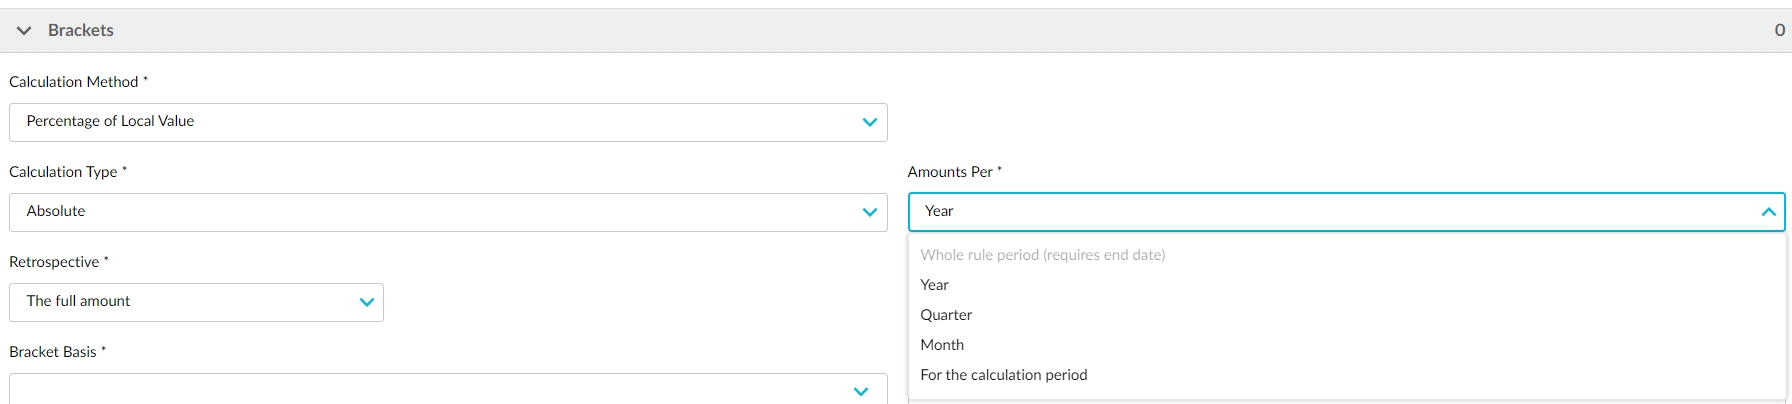
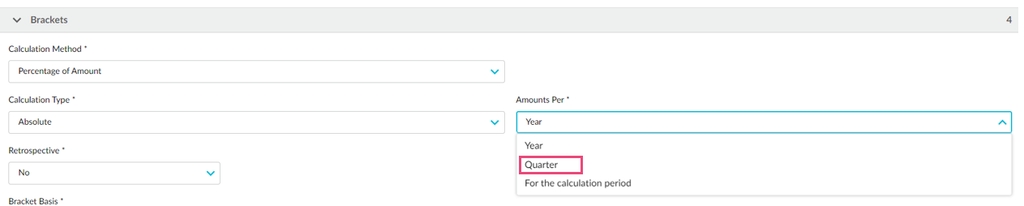
Continuing from recent releases where we introduced the quarterly and monthly options, you can now calculate rebates on a yearly basis and for a whole rule period. These additional options give you greater flexibility when it comes to choosing the period of calculation in the rule setup Amounts per setting.
November 27, 2024: Budgets & Forecasts (version 3.11)
Updates for all users:
Better workflow task information:
The Tasks button now has a Total count and a subtotal of the tasks applicable to the current worksheet. Previously, the Tasks button only showed you how many tasks you had on the currently open worksheet. Now it's clear how many tasks you have in total.
The Tasks window now has a new UI that presents the workflow task details, similar to how they are displayed in the grid, along with the ability to search for a specific task and the ability to view the task list of other tabs in the workbook.
All cell comments in one place: We introduced a new Cell comments button that allows you to quickly view all the cell comments in a workbook. This saves you lots of time, as you no longer need to drill down into the lower levels of the budget to look for comments.
Spread enhancement: You can now spread a range of cells at the workflow level. Previously, you could only spread a range of cells at the total level.
Other changes:
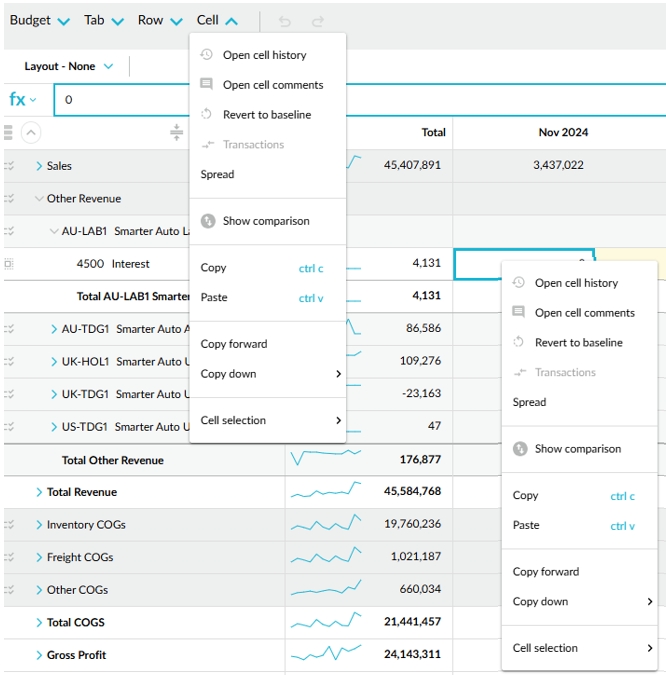
We consolidated the right-click context menus with the corresponding Budget, Tab, Row, and Cell menus that we recently introduced on the top-left of the grid. The respective menus are now consistent with each other, so you have two ways to access the same options. For example, whether you right-click a cell or click the Cell menu, you get the same menu.
We improved the dimension level filters. Now, when you filter one dimension level and then go to filter another one, the list of that dimension's entities is prefiltered according to the first applied filter. For example, if you initially filter by Country > Australia, then go to filter by Sales Rep, you'll only see a list of Australian sales reps. Previously, you'd see all sales reps in the list. This change makes it easier for you to find the items you're looking for. Please note that this change doesn't apply to the budget setup or session filters.
We updated the help links that take you to our user documentation. The links now take you to this user documentation site. We also added more links in places where you might need help, such as in worksheet tab setups.
Updates for budget owners and administrators:
Nested calculation rows: In the budget (Main tab) and the Database, Balance Sheet, Cash Flow, and Reference tabs, you can now show nested calculation rows. This means the rows are expandable just like the category rows, so you can see the breakdown for each dimension level underneath. The calculation rows come from the underlying financial statement. By default, the nested rows are not shown, which means only the total calculation values are shown in the worksheet.
Budget hierarchy enhancement: We changed the hierarchy settings in the budget setup to give you more flexibility and make it consistent with other worksheet tab setups. We removed redundant labels and introduced the ability to reorder levels and determine the workflow level. What you can do depends on the type of budget:
In operational budgets, you can now reorder all the levels and select the level at which you want to workflow to sit.
In financial budgets, you can only reorder the middle levels because Category remains at the highest level and Account remains at the lowest level. The workflow continues to sit at the Account level because of the various drivers that might drive those values.
Publishing enhancement: You now have more flexibility when publishing data to an existing stream. Previously, you could only publish to a stream that exactly matched the structure of the budget or worksheet tab you were publishing. This means it had to have the same dimensions and measures. Now you can publish to a stream that partially matches the budget or tab.
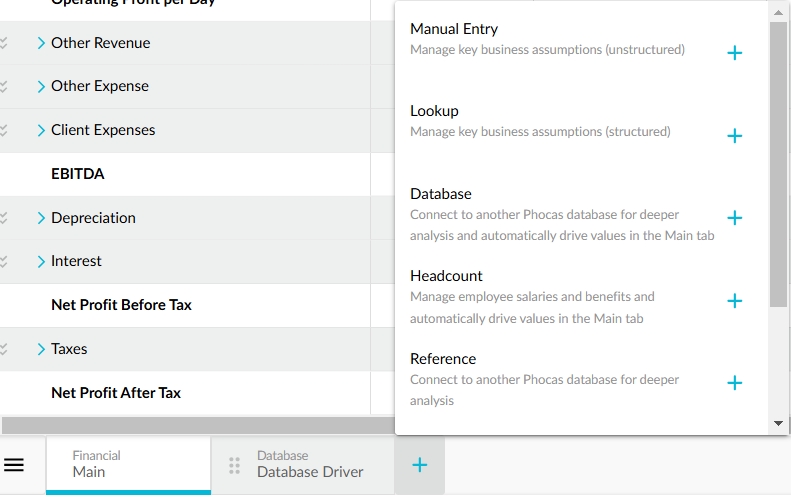
Tab descriptions: Following on from the improvements we made to the add tab process in the last release, you’ll now see descriptions under each tab type, to help you select the worksheet tab that best meets your needs. To accompany this work, we updated the descriptions that display when you hover over a tab name at the bottom of the workbook.
November 13, 2024: Financial Statements (version 24.10.12)
Now when you add a dimension as a level in a statement, that dimension remains available in the Dimension list, so you can click it to open the data in the Analytics module. Previously this option was not available for dimensions added as levels.
November 5, 2024: General news
We're delighted to announce two exciting items...
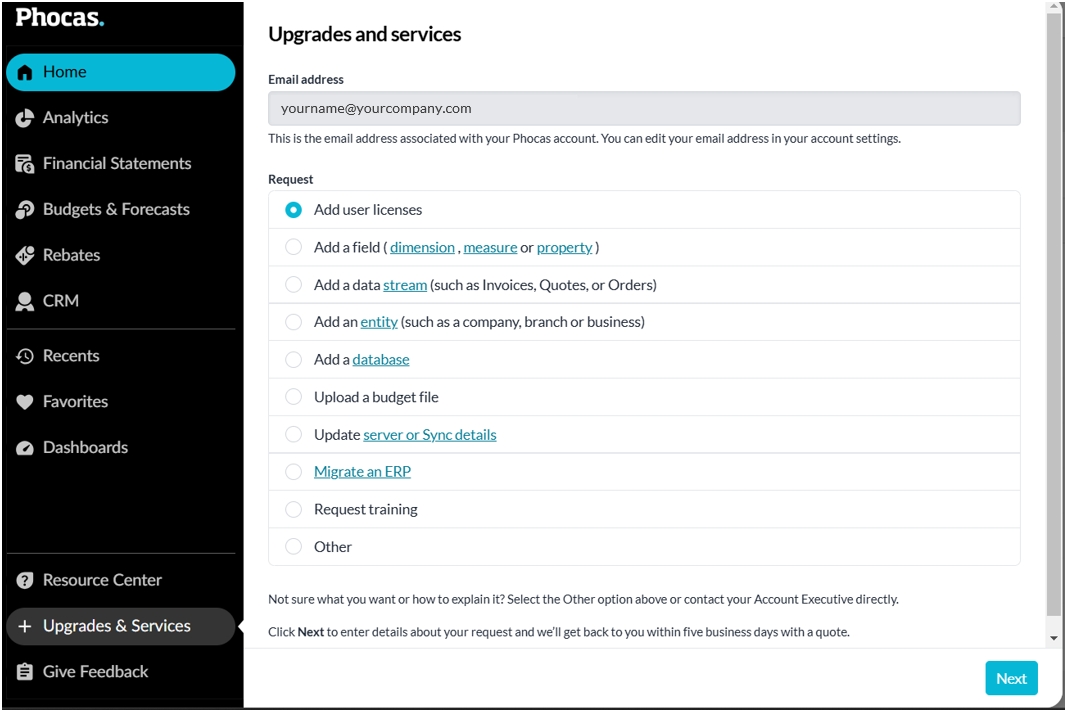
Upgrades and services form
A new form, available in the side navigation in Phocas, makes it easy for you to request upgrades and services from within your Phocas site. Your email address is automatically inserted into the form, and you can select from a list of common requests. For example, you might need additional user licenses or databases, or service work, such as ERP migration or training. If you don't see the request you need, simply select the Other option. Then give us some brief information and submit the form. We'll get back to you within a few days with a quote, and then we can get started on your upgrade or service!
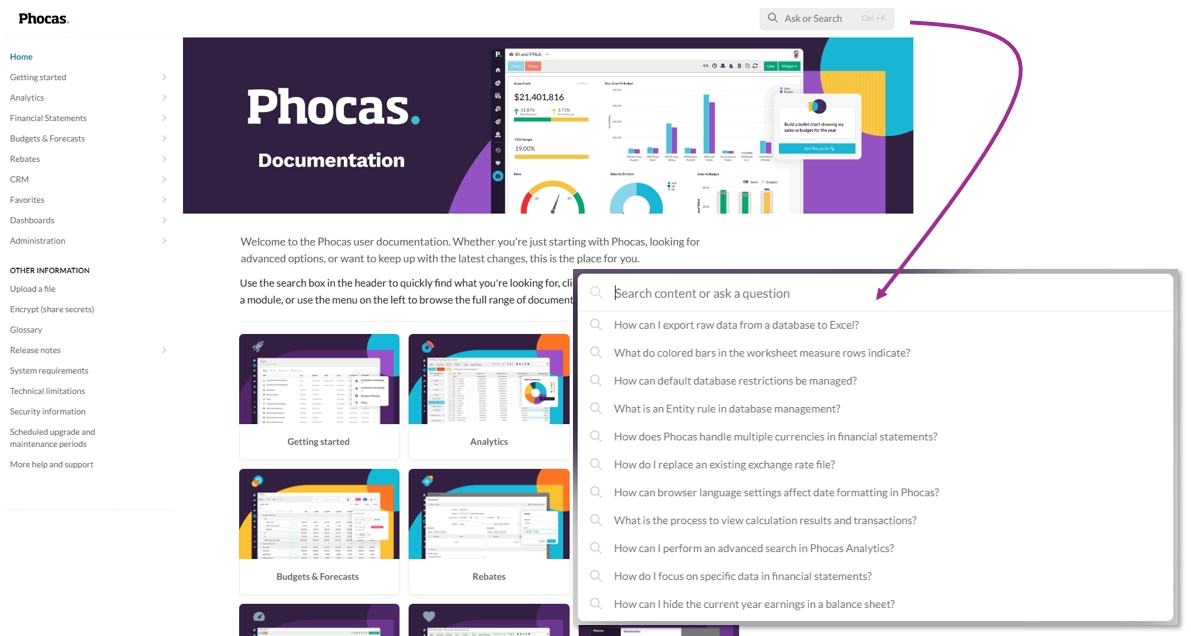
New user documentation site
If you're reading this note, you're looking at our new user documentation site! We've moved our user documentation to this new platform and given it a fresh look with enhanced content display and search functionality, along with an easy-to-remember URL: docs.phocassoftware.com
Please update any bookmarks you have to the old site, which will be retiring soon.
October 25, 2024: Budgets & Forecasts (version 3.11)
Menu enhancements: All the menus, such as the dimension filters in the grid, have an updated style, so they now look and behave consistently. We also implemented new functionality to make it easier for you to select multiple items in menus with long lists. You can click and drag to select the items and use the Shift+click and Ctrl+click keyboard shortcuts.

Ability to use semicolons when searching: When using the search box at the top of a worksheet, filtering a dimension list on a worksheet, and filtering a dimension in the workbook setup, you can now use semicolons in your search terms to quickly search for multiple items simultaneously. This functionality was already available in the Analytics module, so now you can copy codes from the Analytics grid and paste them into Budgets & Forecasts for filtering purposes.

Ability to view transactions in forecasts: Previously, you could only view transactions on a comparison row, but now you can view transactions for anything on the left side of the forecast flag pole, as those values are actuals.

Derived rows now visible: Items that come from Financial Statements but are currently unsupported in Budgets & Forecasts (such as statistical rows or calculation rows that use the BAL function) now display in the budget. You’ll see the name in a light grey color. If there are any errors in those rows, a dash will display in the periods columns instead of the values. The inclusion of these rows means the budget better reflects the underlying financial statement and avoids confusion, as such items are no longer missing.

Updates for budget owners and administrators:
Ability to clone comments: By default, when you clone a workbook, the cell comments in that workbook are now copied into the new workbook. Clear the checkbox to prevent this from happening.

Worksheet tab enhancements:
We’re changing the way you add a worksheet tab to make it quicker and easier to select the one you need. Now when you click the Add tab button, you get a list of tab types to choose from straight away. In the next release, this list will include tab descriptions.

Related to the above point, we made the process of adding a tab consistent across all types of tabs. All tab setups are now in a side panel (drawer).
In the Manual Entry tab setup, you can now select a hierarchy, making this tab more configurable. This works similarly to the same setting in the Lookup tab. It adds dimension columns to the grid from which you can select from a list of entities.

In the Balance Sheet tab, we reorganized the settings and added a checkbox to control the inclusion of the Cash Flow tab. The checkbox setting makes the Cash Flow tab creation process more intuitive and consistent with other settings. Note that if you already have a Balance Sheet tab with a Cash Flow tab, this checkbox will be selected in the Balance Sheet setup by default. If you clear it, you’ll delete the Cash Flow tab.
Allocations enhancement: You can now edit individual allocations rules in bulk. This is suitable when you select all individual from accounts and allocate them to a single account code in each branch.
Small UI and wording changes:
In the budget setup we changed the Template label to Statement to make it clear that the items in this setting list correspond to the statements created in the Financial Statements module.
In the Publish screen, we made some visual changes to clearly differentiate the Export to Excel option from the other publishing options, as it doesn’t publish data to the underlying database.
October 17, 2024: Rebates (version 24.10.5)
Continuing from the last release where we introduced the quarterly option, you can now calculate rebates on a monthly basis. The other options are coming soon.
October 3, 2024: Budgets & Forecasts (version 24.9.4)
Navigation improvements:
The Budgets & Forecasts menu now lists up to 100 budgets and forecast items, ordered by the most recently opened. You can search for all items including those not shown in the list. We also updated the style of the button that takes you to your Budgets & Forecasts homepage, where you can get your full list of items. Also, on your Budgets & Forecasts homepage, we changed the budget workbook icon to match the one that displays on your Phocas homepage, so you can easily identify your budget workbooks in both places.
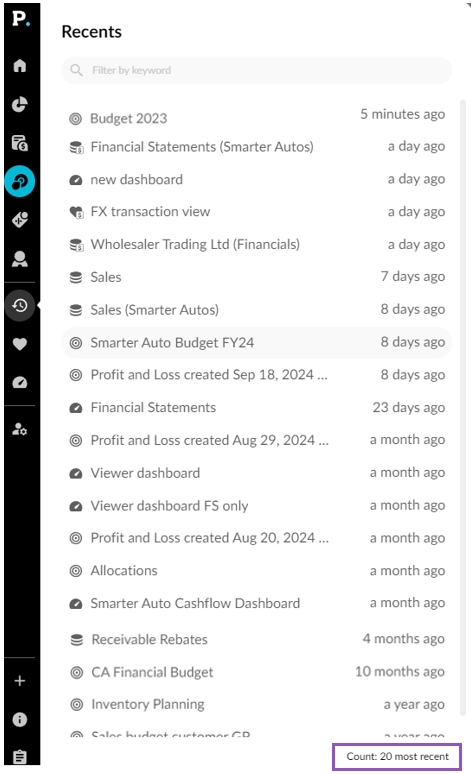
The Recents menu now lists the 20 most recent Phocas items you've opened. Previously, this list only displayed the 10 most recent items.

Wildcard search: You can now use an asterisk to perform a wildcard search. This is particularly useful when trying to find a specific account code. For example:
*100 returns matching items that end with 100, such as 220100.
100* returns matching items that start with 100, such as 100125.
To do a contains search, put an asterisk on both sides of the search term, such as *100*, such as 220100, 100125, and 100100.
Enhancements to additional measures for driver-based budgeting (budget owners and administrators):
We added an Opening row that allows you to take an opening balance into consideration, similar to what a Balance Sheet does, to track movement in values across the budget period. For example, this could be the movement in the quantity of customers, staff, or stock. A common use case for this row is for demand planning as part of inventory or fund management.
You can now populate the input rows with either zeros or data from a baseline stream. Previously, you had to select a stream. This enhancement allows you to have a different baseline for the input rows in the worksheet. For example, you can populate the top-level rows in the budget with data from a stream but then add an input row that contains zeros instead of that stream data.

We added labels to the parent measure rows to identify what the values represent. You can edit these labels in the setup. Previously, only the child rows had labels.

Several worksheet tab enhancements (budget owners and administrators):
When adding a Balance Sheet tab, you can now use the start month of the budget to get the opening balance. Previously, you had to select a month before the budget start month.

When publishing a Reference tab that uses a balance forward stream, we now implement the same logic that is used when publishing a Balance Sheet tab. Therefore, if you publish to a new stream, a new balance forward stream is created in which the opening balance and deltas for each month are published, rather than the monthly values. If publishing to an existing stream, you can only publish to an existing balance forward stream.
You can now apply a tab-wide format for the measures in the Manual Entry tab. This saves time, as all rows you add in the tab will get this measure formatting. You can then edit the format for individual rows as required to override that default format. For example, you can add a default format of two decimal places for all the values but then change the row that contains exchange rate data to have four decimal places.
We added warning messages to the Headcount tab import process to let you know when a file contains duplicate ID records. We don't support duplicate IDs; they must be unique. However, when you import data they can have duplicate IDs in the file. The duplicates aren’t imported, so you might see that the imported data is different from the data you have in file. For example, if you have 240 rows in the file and 202 are duplicates, only 40 rows will be imported. We also made some minor label changes on the Headcount tab for consistency with the corresponding items in the setup and better understanding.
October 1, 2024 (version 24.9.4)
Analytics
In the side navigation Recents menu, you can now see the 20 most recent items you've opened. Previously, this list only displayed the 10 most recent items.
Financial Statements
We improved the performance of the entity lists in the levels and column groups boxes. When a list contains many entities, these long lists now display more efficiently, and you can select items as expected.

We improved the performance of the grid in the Groups window. When using the activity filter on a group that contains many entities, the filter now works as expected. Also, all items with activity are now displayed by default.

In the side navigation Recents menu, you can now see the 20 most recent items you've opened. Previously, this list only displayed the 10 most recent items.

September 19, 2024: Rebates (version 24.8.4)
You can now calculate rebates on a quarterly basis. Of the many variations of calculating rebates, a primary differentiator is the period of calculation and payout. Up to now, you could calculate for a period of a year or the calculation period. We are introducing more period options to allow you to calculate in smaller intervals within a period of a year. We’re starting with quarters but soon, we’ll introduce options for months and a fiscal year. The new Quarters option is being rolled out to customers in stages, so you should see it in your rule setups soon.
Phocas On-Premise: End of support notice for SQL Server 2014
Microsoft announced in July 2024 that SQL Server 2014 is no longer a supported product. Phocas will end support for SQL Server 2014 from November 2024.
After the end-of-support, you can continue to use Phocas; however, you won't be able to upgrade to newer versions. Some features and functionality may no longer function as expected.
Phocas encourages users to upgrade to a supported version of Microsoft SQL Server (2016 at least) or to contact us to learn about the benefits of moving to Phocas cloud to automatically access to new features and functionality.
03 September, 2024: Finacial Statements (version 24.8.1)
We added custom sort order functionality to dimension groups. This allows you to determine the position of each item in the dimension (entity list). The custom sort order is reflected in the financial statement.
We are in the process of migrating each organization’s account mapping feature to dimension groups. This is a phased migration, so you’ll notice a change in the statement setup window when your organization has been migrated.

The first phase of the migration is the creation and mapping of account sub-dimensions. You no longer do this in the Accounts tab of the statement setup window. You now do it in the Groups window. Watch the following video or see Create sub-dimensions for accounts to learn how.
This change brings the following benefits:
Previously, there was a limit of three sub-dimensions per statement. We’ve removed this limit.
Previously, you had to map accounts statement by statement, but now you do all the mapping in one grid.
You no longer have to map the Profit & Loss and Balance Sheet sub-dimensions separately, as all accounts are combined into one list. This enhances the analysis available to your Trial Balance and Cash Flow statements.
You can take advantage of the groups functionality to manage your accounts, such as export to and import from Microsoft Excel to help with the mapping process, clone a statement and filter the mapped and unmapped items in each column (group), and apply a custom sort order to any group.
Financial statements with one stream (no comparative columns) added as widgets on the dashboard now show the stream name, such as Actuals. Previously, this information was only available when there were multiple streams applied to the statement.

We resolved an issue that occurred when you viewed transactions. The Back button wasn’t working. You can now go back to your previous screen as expected.
We fixed an issue in the Groups window whereby selecting a group didn't work on the first try, requiring you to repeat the action. This now works the first time as expected.
Last updated
Was this helpful?