Rebates analysis
Analyze your rebate data in the Analytics module.
The Rebates Analysis database opens in the Analytics module. As long as you have permission to access this database, you’ll see it on your homepage (alongside the other databases) and in the Analytics menu. You might also have corresponding rebates-related dashboards, accessible via the Dashboards menu.

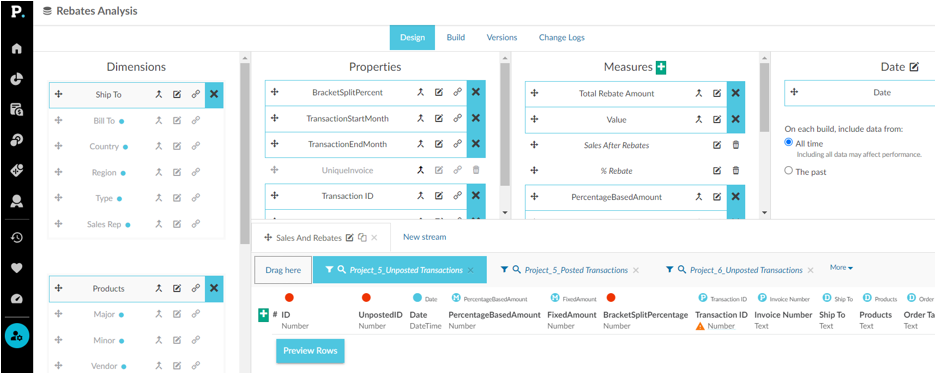
The Rebates Analysis database is built from rebates-specific data streams (Posted and Unposted Transactions) and measures, such as Total Rebate, Percentage, Fixed, and so on. Here’s an example of what the database design might look like to an administrator:

When you open the database in Analytics, you can view your rebates by various categories (dimensions), such as Customer, Region, Bracket, and so on. In the following example, you can see all the different brackets from your rebate rules, the total amount of rebate in each one, and the rebate amounts being paid out each month.

Use the Rebates Analysis database to analyze the total rebate amount and the breakdown. For example, in the case of Payable rebates, you can see how much you’re paying out overall and how much you’re going to pay each customer.
Analysis limitations
A common misconception is that the Rebates Analysis database can be used to analyze the profitability of rebates at a Customer level. This isn't possible because the database is based on your rebates data, not your sales data. So, whilst the database contains measures like Value and Profit Margins, they're only accurate at the rebate level because they are taken from the rebate calculations.
For example, suppose you’re analyzing your Sales database in the Analytics module and see a $125 sales transaction for a customer in March.

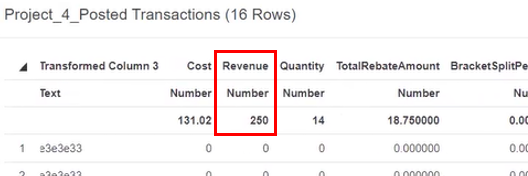
In the Rebates module, you have two rebate rules for that customer based on sales. When you run the calculations for those rules in that period, the $125 transaction is copied into each one. This results in a sales total of $250 ($125 x 2). This is just the sum of all the transactions used in the calculations, it might not be the actual sales total.

So, in the Rebates Analysis database, if you analyze the data by Customer or another dimension, the sales value you see is not the same as the sales value in your Sales database. Instead, you see the sales value that has been processed to calculate the two rebates. This is how the Rebates Analysis database is designed to work. To analyze customer profitability, use the Sales database.
Last updated
