Explore the Balance Sheet and Cash Flow budgets and forecasts
Learn about the key elements of the Balance Sheet and Cash Flow tabs in financial budget and forecast workbooks.
When you create a Balance Sheet budget, a new tab is added to your budget workbook for that Balance Sheet budget. If you opted to include a Cash Flow budget (for 3-statement budgeting), it displays in a separate tab. If a budget workbook with a Balance Sheet and Cash Flow is converted into a forecast (as long as it was published first), the forecast will also contain a Balance Sheet and Cash Flow tab.
Balance Sheet budget
Click the Balance Sheet tab (its name depends on whatever you called it) to view the budget, which has the following key elements, as identified by the numbers in the image below.
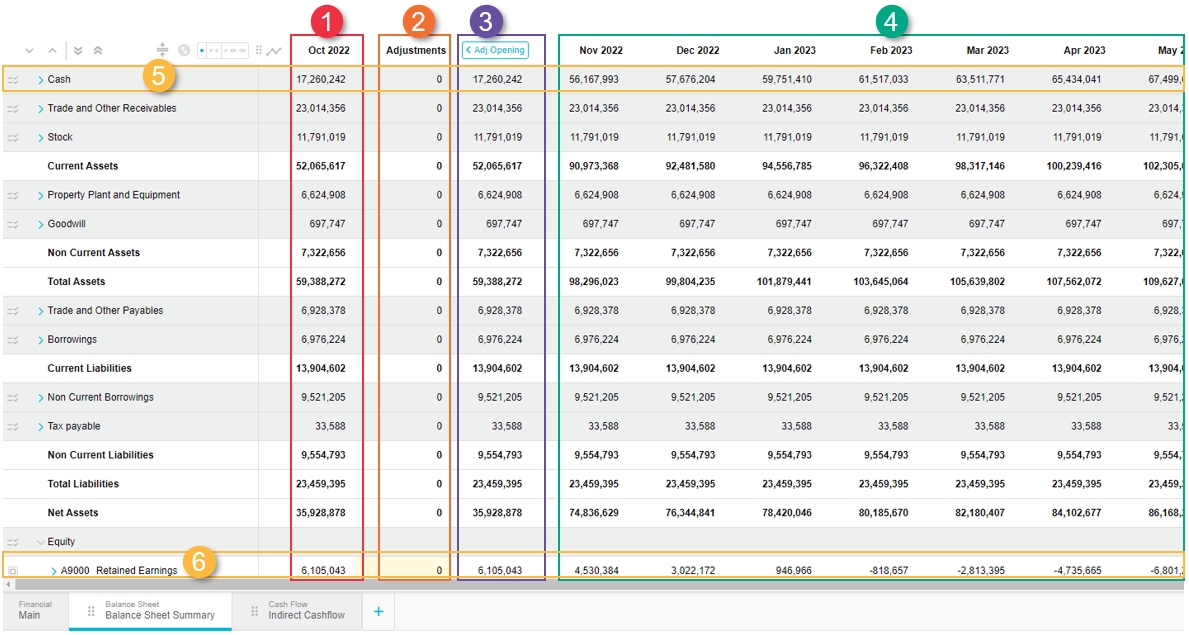
Opening balance column: Contains the data brought in from the selected stream.
Adjustments column: Contains editable cells where you can enter adjustments to reset opening balance.
Adjusted opening balance column: Displays the new opening balance after your adjustments are taken into account.
Period columns (grid): Contains with budget data based on the selected stream. The data in each column references the data in the column to its left. For example, January 2021 references the Adjusted Opening column and February 2021 references January 2021. For this reason, you might notice that the values in many of the columns are the same. If you enter a value in a cell, you will see that everything to the right of that cell will change.
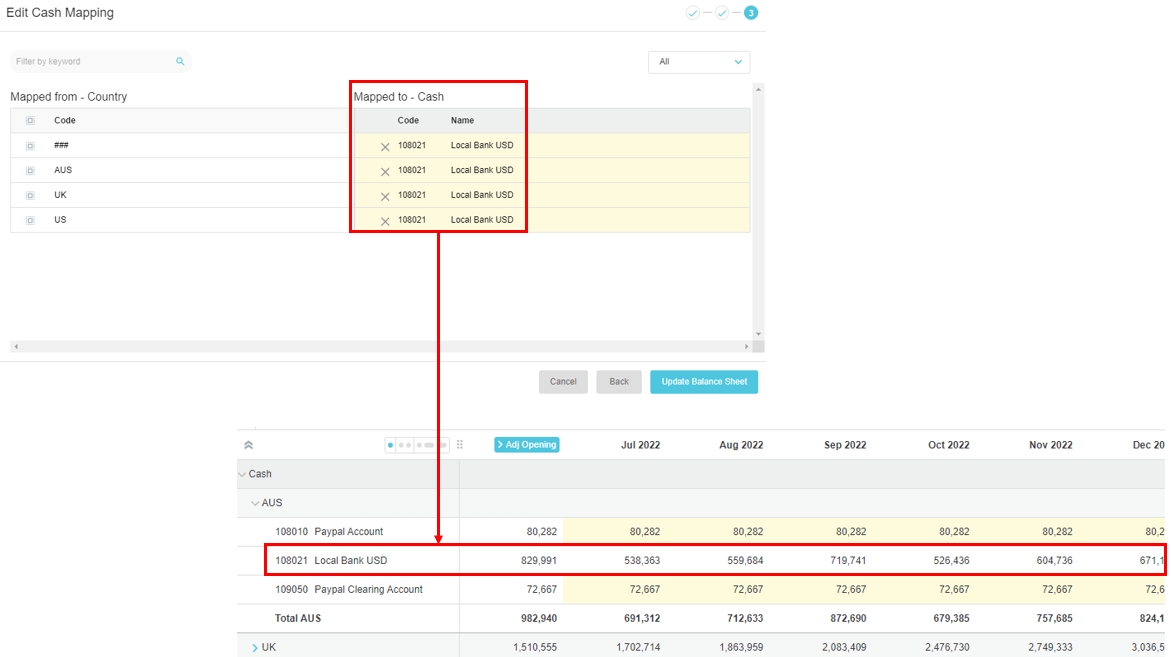
Cash account row: This row is mapped in the Balance Sheet setup and is used for the offset of all the other movements in the Balance Sheet (it's used as a balancing account).
When the Balance Sheet tab is first added, Retained Earnings and Cash are the only rows that will have movements. Retained Earnings will be impacted by the Profit and Loss in the Main tab and the Cash row will reflect the offset of this, to ensure the Balance Sheet balances.
As cells are edited in the Balance Sheet, the Cash row updates to offset the changes. An example of this is a decrease in Accounts Payable would be offset by a decrease in Cash to reflect the payment of creditors.
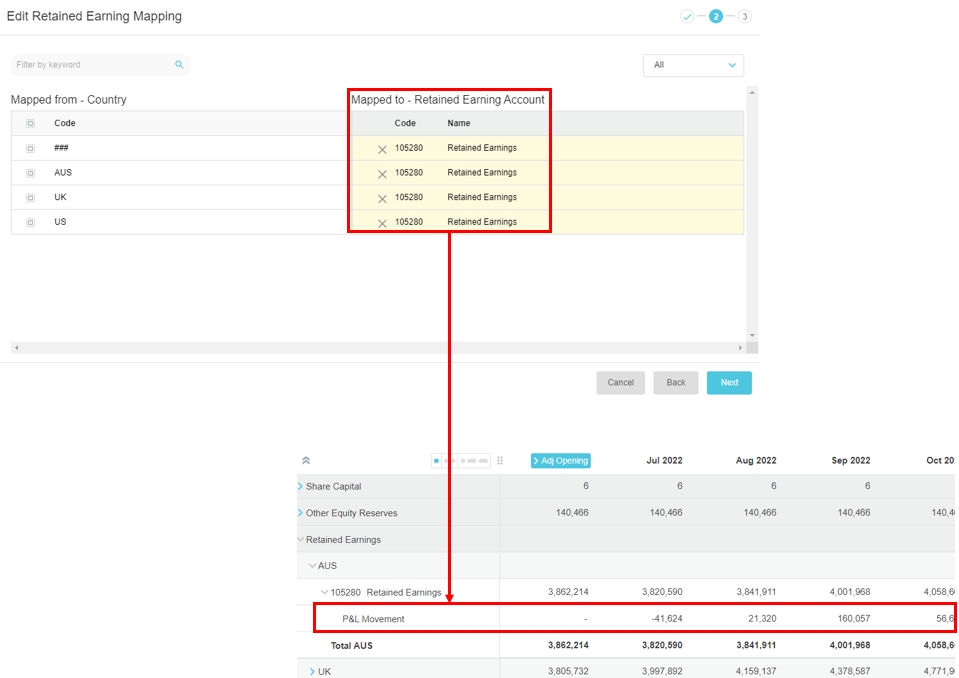
Retained Earnings account row: References the Main tab to reflect the Profit and Loss impact on the Balance Sheet. The value is the sum of the Profit and Loss accounts on the Main tab. You can’t edit it, as indicated by the white background.
The Balance Sheet might also include mini driver lines.
Cash Flow budget
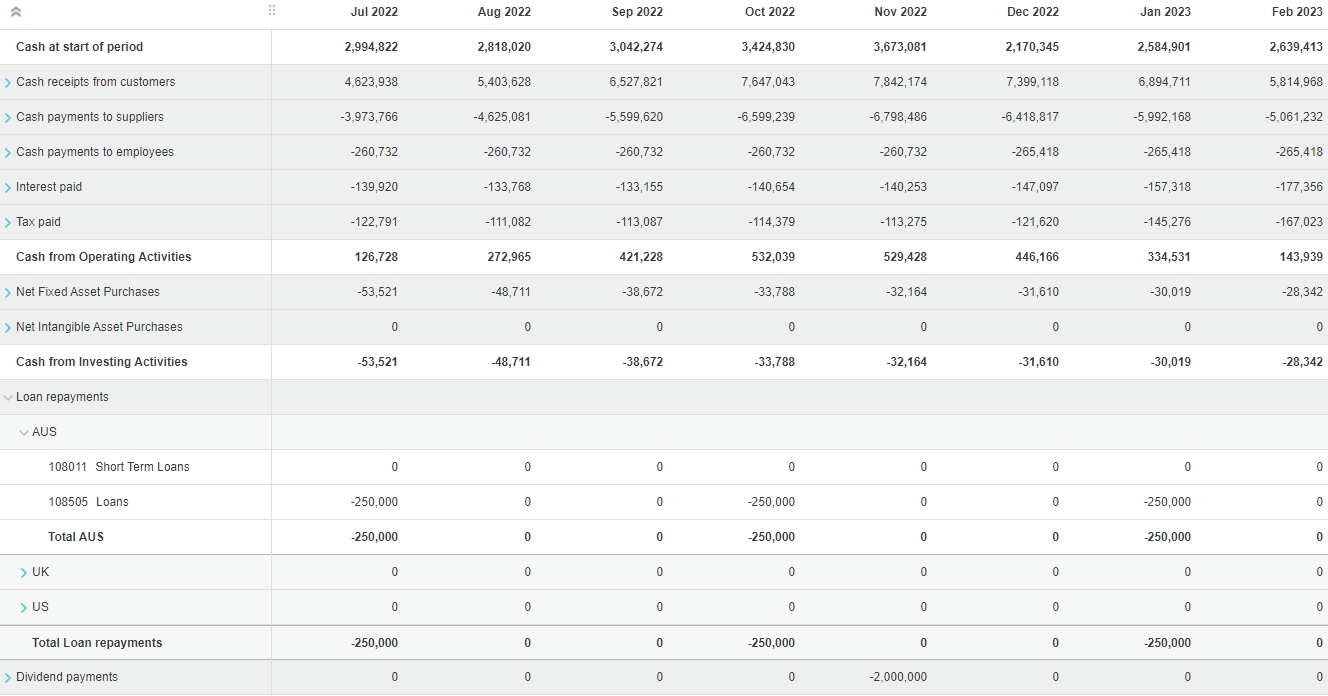
Click the Cash Flow tab (its name depends on whatever you called it) to view the budget, where you can see the derived budget values.
Balance Sheet forecast
The forecast in the Balance Sheet tab has a slightly different configuration to that of the Main tab. As it does not make sense to total the values in the Balance Sheet, different information is displayed in the columns.
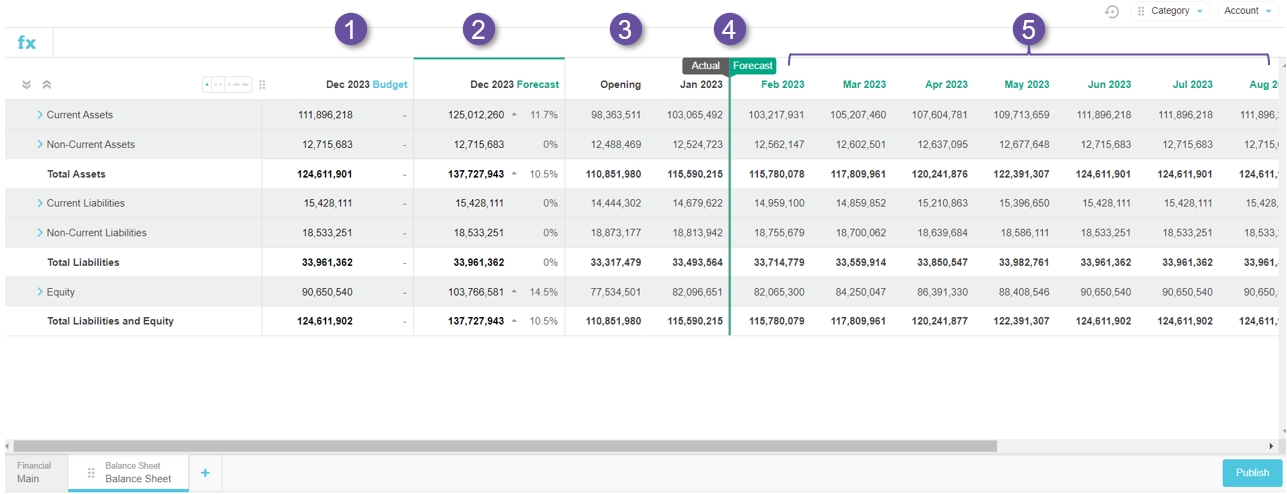
Budget column: Click this column to view the actual and budget values for the entire period in the grid. The column itself references the values in the last column of the grid (last budget period). The actual values display to the left of the flagpole and the budget values display to the right. A dotted vertical line displays at the end of the last fully completed month (period). The cells are not editable in this view, as the information is for reference purposes only. This view is useful when you start reforecasting, as you can use the flagpole to see what your original budget was.
Forecast column: Click this column to view the actual and forecast values in the grid according to the period that was selected in the forecast setup, for example 1+11, 3+9 and so on. The actual values display to the left of the flagpole and the forecast values display to the right. A dotted vertical line displays at the end of the last fully completed month (period). You can edit the yellow cells.
Opening column: This column displays the opening balance, which is the first column before the budget period starts.
Flag pole: This tool allows you to switch between the different data. The default position of the flagpole identifies the latest current actual data, as defined in the forecast setup. You can drag the flag pole back to view the different data (from actual to forecast/budget). You cannot drag the flagpole forward past a certain period because you do not have any actuals for those periods (future periods).
Period columns (grid): This is where the actuals, budget and/or forecast values display. Any formulas that were in the underlying budget workbook are retained in the forecast.
The rows in the Balance Sheet forecast are similar to those of the underlying budget.
Last updated
