> For the complete documentation index, see [llms.txt](https://docs.phocassoftware.com/llms.txt). Markdown versions of documentation pages are available by appending `.md` to page URLs; this page is available as [Markdown](https://docs.phocassoftware.com/budgets-and-forecasts/owner-and-administrator/customize-the-format-of-measures.md).
# Customize the format of measures
Override the default formatting of the values you see in a worksheet to suit your budgeting needs.
{% hint style="info" %}
User permissions: Budgets & Forecasts and Manage Budgets & Forecasts
{% endhint %}
Measures are different types of numerical data values that are displayed on the various tabs of a budget or forecast workbook.
Sometimes the precision of a value is important. Budgeting items like gross profit margins, product prices, exchange rates, and so on often requires at least two decimal places, sometimes more. For example, you might want to budget revenue and expense line items to the cents (or pence) level or include a suffix to identify the currency.
Custom measure formatting allows you to override the default formatting in the underlying database. You can define the number of decimal places each measure has, along with any prefix or suffix information.
See how the format of a measure in the database design determines the default (source) format in Budgets & Forecasts
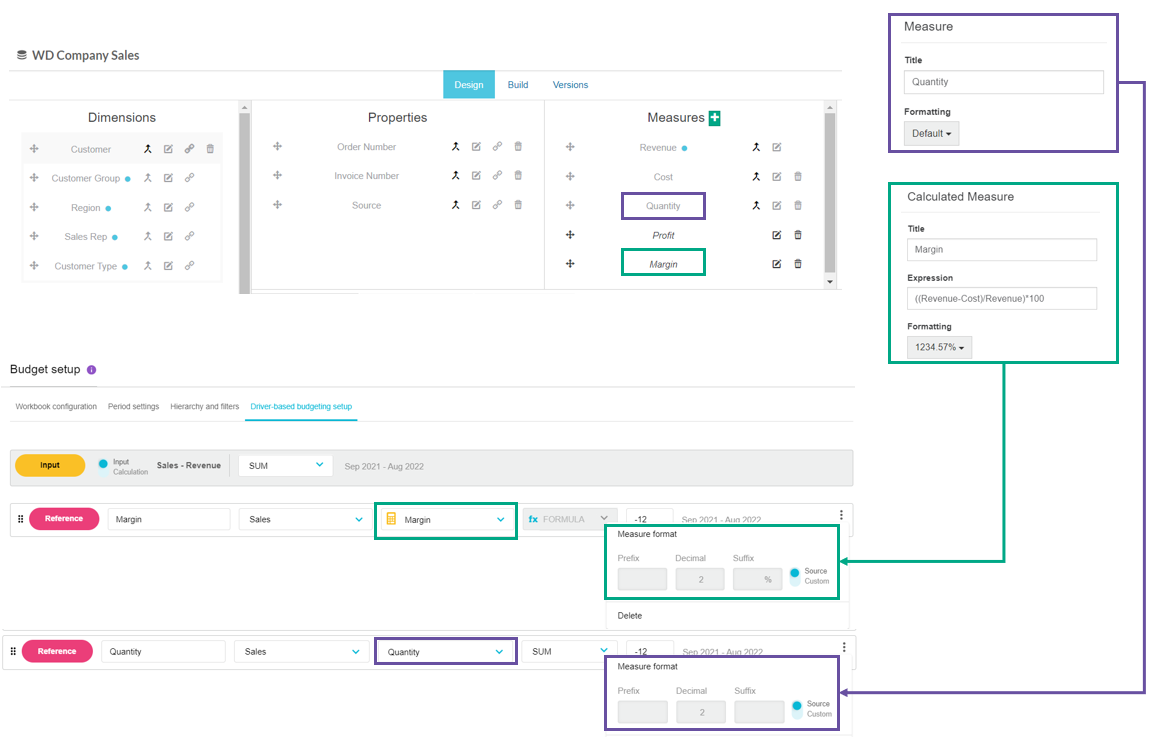
If you have access to [Designer](broken://pages/LPWlRqrbP3ugSCA0ZiwS), you will be able to check the format of the measures in a database. In the following example, additional measures were added to a Sales budget, taking the source format from the corresponding measures in the underlying database. Both the Quantity and Margin measures have two decimal places and the Margin also has a percentage sign suffix.
When you view these rows in the budget, you can see they have different formatting, and neither formatting is the same as the parent row.
It's important to remember that when you define a custom measure, your changes are visual only; you only change how the values in the worksheet (grid) display for you and other users. You don’t make any changes to the measures in the underlying database design. In the case of a value that has been rounded to zero decimal places, you can still see the full amount in the **fx** bar above the grid.
The following examples demonstrate how you can apply a custom format to measures in different places throughout Budgets & Forecasts.
Format measures in a financial budget
When you set up a financial budget, you can choose how to format its measures:
* **Source**: Uses the formatting of the measure in the underlying database.
* **Custom**: Overrides the source formatting. You can specify the number of decimal places and add a prefix or suffix, such as a dollar sign.
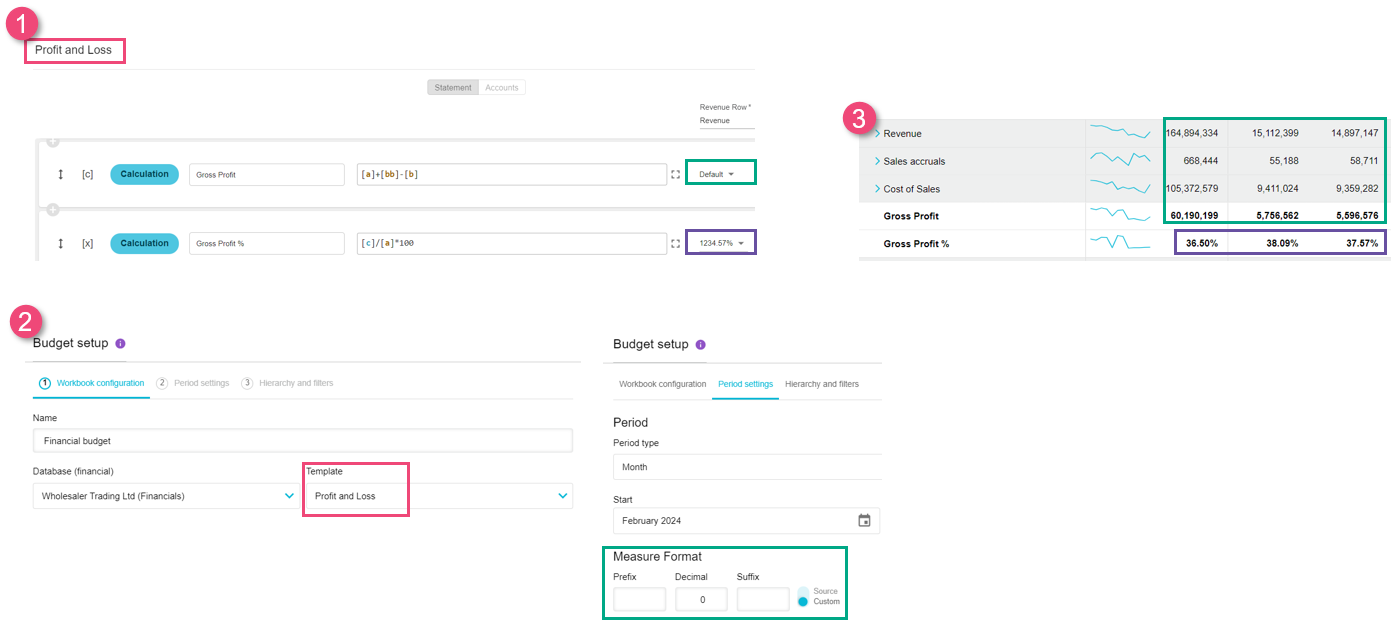
In a financial budget, the rows are derived from the underlying financial statement. If a custom measure format is applied to an item in the statement setup, that format is carried through to the budget and can’t be overridden by the custom format you apply in the budget setup. For example:
* In image 1, you can see the Profit and Loss statement setup window, where the Gross Profit row has a default format but the Gross Profit % row has a custom format.
* In image 2, you can see the budget setup is based on that statement and a custom format of 0 decimal places is applied.
* In image 3, you can see the budget in which all the measures have the custom format (0 decimals) as per the budget setup except for the Gross Profit % row, which retains its custom format from the financial statement.
Format measures in an operational budget with additional measures
When you add measures for driver-based budgeting, you can format each additional measure independently.
By default, additional measures use **Source** formatting, which uses the formatting of the corresponding measure in the underlying database. Select **Custom** if you want to override the source formatting and specify a different number of decimal places, prefix or suffix.
For example, in a Sales budget you might use different formats for each additional measure:
* **Quantity**: No decimal places.
* **Price**: Two decimal places.
* **Margin**: Two decimal places with a percentage sign suffix.
* **Cost**: Two decimal places.
* **Working days**: One decimal place if your working days calendar includes half working days.
* **Sales per day** (working row with formula): Zero decimal places (default) changed to two decimal places. This type of row doesn’t have any source formatting.
Working lines, such as a Sales per day row containing a formula, don't have an underlying database measure and therefore don't have source formatting. You can apply custom formatting to these rows instead.
If you apply custom formatting to an additional measure and later want to use its database formatting again, switch it back to **Source**.
Format measures in comparison rows
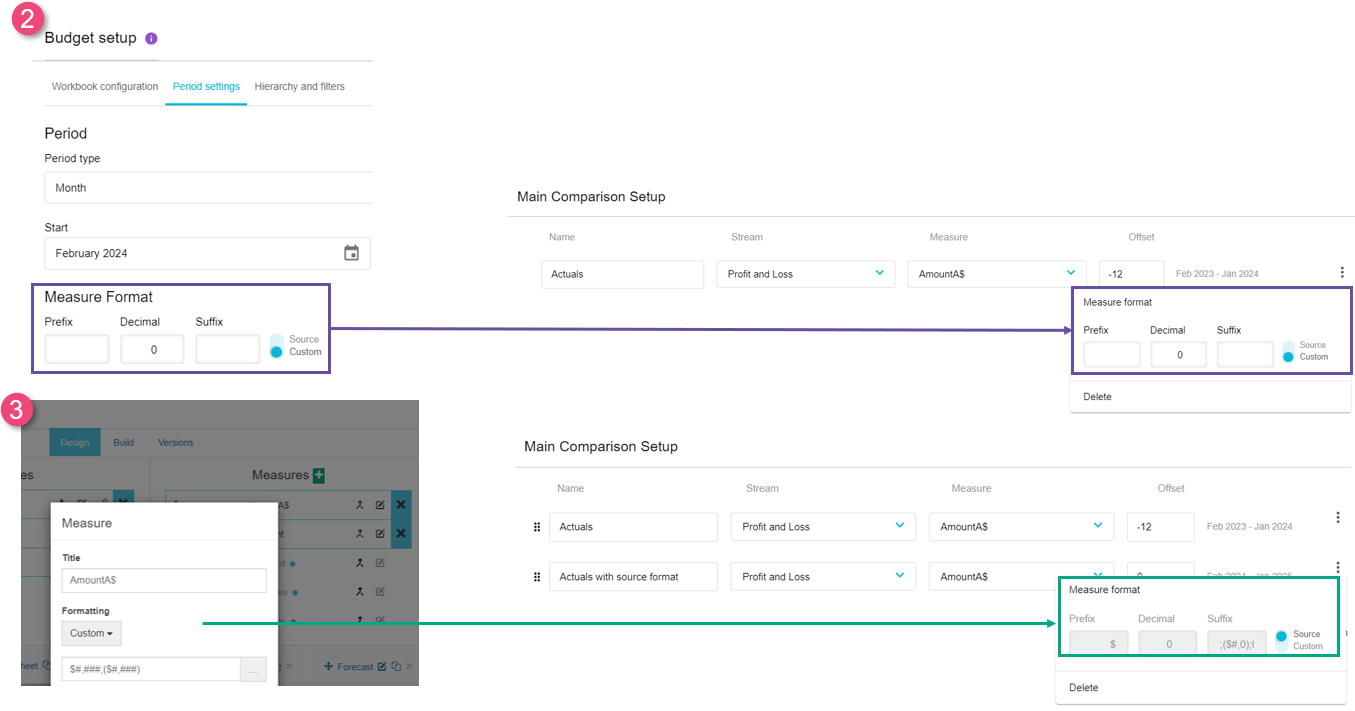
The first (default) comparison row in the Main, Database, or Reference tab of a workbook gets its formatting from the parent row of the respective tab, which in turn comes from the tab setup. Any subsequent comparison rows you add get their formatting from the selected measure in the underlying database.
For each comparison row, you can use the **Source** formatting or apply a **Custom** format to override it. This allows you to format comparison rows to match the rows they are comparing.
For example, in image 1, you can see two comparison rows showing the same measure but with different formatting. The first comparison row gets its formatting from the parent row by default (image 2). The second row gets its formatting from the measure, which has custom formatting applied (a dollar sign prefix) in the database design (image 3).
Format measures in working and sum lines
By default, the measures in [working and sum lines](/budgets-and-forecasts/contributor/edit-values-in-a-worksheet/use-sum-and-working-lines.md) take on the same formatting as the measures in the parent row, which comes from the budget or workbook tab setup. There’s no *source* formatting option for either line type, as their values don't come from an underlying database.
Custom formatting works differently in working and sum lines:
* **Working lines:** You can apply custom formatting via the menu button to the left of the working line name. For example, you might use zero decimal places for a quantity and two decimal places with a dollar sign prefix for a price. This formatting overrides the formatting inherited from the parent row and is retained if the budget or workbook formatting changes.
* **Sum lines:** You can't apply custom formatting because a sum line sums up to its parent row. Instead, it always takes on the formatting of the parent row. For example, if the parent row displays zero decimal places, the sum line does too. If you change the budget or workbook formatting to two decimal places, the sum line picks up that formatting.
Display formatting doesn't affect the underlying value. If you enter a value with decimal places in a sum line, the full value is retained and visible in the **fx** bar, even if those decimal places aren't displayed in the worksheet.
Format measures in Database and Reference tabs with additional measures
The process of formatting measures in [Database](/budgets-and-forecasts/owner-and-administrator/add-worksheet-tabs/database-tab.md) and [Reference](/budgets-and-forecasts/owner-and-administrator/add-worksheet-tabs/reference-tab.md) tabs is the same, as both of these tabs have a similar setup.
For the parent measure, you can use **Source** formatting from the underlying database measure or apply a **Custom** format. If you add additional measure rows for driver-based budgeting, you can format each row independently of the parent measure and other additional measures.
The formatting options available for additional measures depend on the row type:
* **Input and Reference rows**: As you must select a measure from the underlying database, you can use the source formatting from that measure or override it with custom formatting.
* **Calculation, Working, Days, and Lookup rows**: If you don't publish to a measure, you can only define a custom format, as there is no source format to use. If you do publish to a measure, you can use the source formatting from that measure or define your own custom format.
Format measures in a Lookup tab
The measures you use in a [Lookup tab](/budgets-and-forecasts/owner-and-administrator/add-worksheet-tabs/lookup-tab.md) don't have a **Source** format option because their values don't come from an underlying database measure. Like working lines, you can only apply custom formatting.
By default, lookup measures are displayed with zero decimal places and no prefix or suffix. You can customize the format of each lookup item to suit the type of value you're entering.
For example:
* **Exchange rate**: Six decimal places to display the required level of precision.
* **Sales growth rate**: Two decimal places with a percentage sign suffix.
Format measures in a Manual Entry tab
You can set the default measure format when you [add the Manual Entry tab](/budgets-and-forecasts/owner-and-administrator/add-worksheet-tabs/manual-entry-tab.md) or [edit its setup](/budgets-and-forecasts/owner-and-administrator/manage-worksheet-tabs.md#managetabs-editthetabsetup). That format automatically applies to all rows you add in the tab.
As a Manual Entry tab can contain different types of values, you can override the default format for individual rows. For example, you might format:
* A growth percentage with two decimal places and a percentage sign suffix.
* An exchange rate with six decimal places.
* An hourly rate with two decimal places and a dollar sign prefix.
To override the format of a row, click the menu button in its **UOM** cell to open the **Measure format** window. Enter the prefix, number of decimal places, and suffix as required, then click out of the window.
Format measures in a Balance Sheet tab
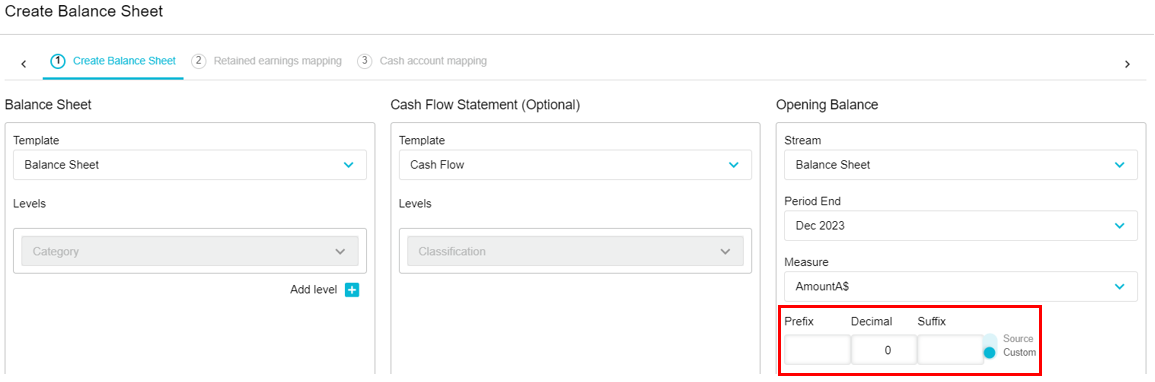
In the Balance Sheet tab, you can switch between the source formatting (which comes from the selected measure) and your custom formatting.
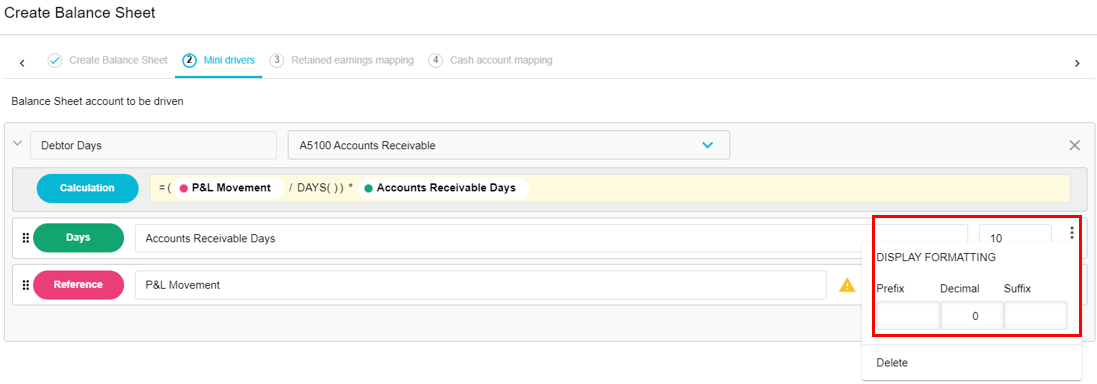
If you add mini drivers, there’s no source format, as there’s no measure associated with those rows but you can define a custom format.
If you include a Cash Flow tab, the formatting for the measures in that tab comes from Main tab and you can’t change that.
---
# Agent Instructions
This documentation is published with GitBook. GitBook is the documentation platform designed so that both humans and AI agents can read, navigate, and reason over technical content effectively. Learn more at gitbook.com.
## Querying This Documentation
If you need additional information that is not directly available in this page, you can query the documentation by asking a question.
Perform an HTTP GET request on the following URL with the `ask` and `goal` query parameters:
```
GET https://docs.phocassoftware.com/budgets-and-forecasts/owner-and-administrator/customize-the-format-of-measures.md?ask=&goal=
```
`ask` is the immediate question: it should be specific, self-contained, and written in natural language.
`goal` is what the user is ultimately trying to achieve, the reason they need the answer. Sharing it helps GitBook give you a better, more relevant answer. A goal is most helpful when it describes the outcome the user wants rather than restating the question. For example, with `ask=how do I create an API token`, a goal like `automate deployments from our CI pipeline` lets GitBook tailor the answer to that use case.
The response will contain a direct answer to the question and relevant excerpts and sources from the documentation.
Use this mechanism when the answer is not explicitly present in the current page, you need clarification or additional context, or you want to retrieve related documentation sections.
 When you view these rows in the budget, you can see they have different formatting, and neither formatting is the same as the parent row.




 If you add mini drivers, there’s no source format, as there’s no measure associated with those rows but you can define a custom format.
 If you include a Cash Flow tab, the formatting for the measures in that tab comes from Main tab and you can’t change that.