LogoLogo
More help and supportPhocas website
  • Home
  • Getting started
    • Navigation
    • Homepage
    • Data access
    • User licenses, profiles and permissions
    • Account settings
    • Databases
    • Periods
      • Offset dates
      • Default period for a database
    • Sharing and folders
      • Share a dashboard, favorite, or alert
    • Subscriptions
  • Analytics
    • Take a tour of Analytics
    • Work with the grid
    • View a summary of the data
    • Customize your view (Analytics)
      • Change the mode
        • Period mode
        • Period Variance mode
        • Period Stream mode
        • Moving mode
        • Stream mode
        • Total mode
        • Transaction mode
        • Matrix mode
        • Matrix Variance mode
        • Matrix Share mode
        • Variance mode
        • Search mode
        • Market mode
        • Custom mode
      • Change the properties (Analytics)
      • Change the measures (Analytics)
      • Change the stream
      • Use the activity filter
      • Change the data format
      • Change the period (Analytics)
    • Drill down into your data (view transactions)
    • Filter data (use dimensions)
    • Select data (Analytics)
    • Focus on data (Analytics)
    • Copy or export data
    • Search for data
      • Perform a basic search
      • Perform an advanced search
      • Search for similar or comparative data (right-click filter)
    • Add levels to the grid (grid nesting)
    • Compare data with Matrix mode
    • Get more options for viewing data
    • Visualize your data in a chart
      • Bar and Column charts
      • Combo chart
      • Pareto chart
      • Waterfall chart
      • Line chart
      • Area and % Area charts
      • Pie and Donut charts
      • Bubble chart
      • Radar chart
      • Gauge chart
      • Bullet chart
      • Summary and Ring Summary charts
      • Map charts
      • Configure the chart options
      • Select and focus on a chart segment
      • Export a chart as an image
      • Use the chart legend
    • Save favorites and add to dashboards (Analytics)
    • Reset data
    • Phocas AI
    • Flex Modes
      • Switch modes
      • Filter data (Flex Modes)
      • Apply conditional formatting
      • Add levels to the grid (Flex Modes)
      • Manage columns (Flex Modes)
      • Save and share a favorite (Flex Modes)
      • View your data in a chart (Flex Modes)
  • Financial Statements
    • Take a tour of Financial Statements
    • Overview of access to financial statements
    • Customize your view (Financial Statements)
      • Change the properties (Financial Statements)
      • Change the measures (Financial Statements)
      • Change the period (Financial Statements)
      • Change the current data
      • Change the budget data
      • Change the columns
      • Change the style
      • Change the rows (activity filter)
    • Filter the financial information
    • Select and focus on data (Financial Statements)
    • Copy or export financial information
    • Add a level in a financial statement
    • View financial information in a matrix (change column groups)
    • Add and view comments (Financial Statements)
    • View transactions (Financial Statements)
    • View financial information in a chart
      • Create a Pie and Donut chart (Financial Statements)
      • Create a Value card
      • Export a financial chart widget as an image
    • Save and share favorites (Financial Statements)
    • Add financial analysis to a dashboard
    • Manage financial statements
      • Overview of financial statements and dimensions
      • Create a financial statement
      • Delete a financial statement
      • Customize a financial statement
        • Rename a financial statement
        • Reorder a financial statement
        • Customize account groups
        • Customize calculations
          • Functions for Profit & Loss calculations
          • Formulas for financial ratios
        • Customize headings and spacers
        • Set the revenue row in a Profit & Loss statement
        • Customize columns
        • Customize a Cash Flow statement
          • Common account mapping for Cash Flow statements
        • Rebuild the database
      • Set the financial year end date
      • Map the Retained Earnings account(s)
      • Restrict access to accounts
      • Manage budget streams (Financial Statements)
        • Create a budget (Financial Statements)
      • Use statistical streams
      • Use multiple currencies
      • Manage dimension groups
      • Map categories from your Chart of Accounts
  • Budgets & Forecasts
    • Overview of key terms and concepts
      • Budgets versus forecasts
      • Users and data access
      • Relationship with the Financial Statements module
      • 3-statement budgeting
      • Filtering methods
      • Demand planning
      • Loan repayments
    • Take a tour of Budgets & Forecasts
      • Explore the budget workbook
      • Explore the forecast workbook
      • Explore the Balance Sheet and Cash Flow budgets and forecasts
    • Customize your view (Budgets & Forecasts)
      • Filter a worksheet (search for items)
      • Group period columns
      • Use layouts
    • Use session filters
    • Edit values in a worksheet
      • Open workbook notes
      • Use keyboard shortcuts
      • Copy and paste values
      • Use comparison rows
      • Use sum and working lines
      • Use formulas
      • Spread totals
      • Revert to the baseline values
      • Edit the Balance Sheet budget
      • View and use headcount data
    • Refresh a workbook
    • Use workflows
      • Contribute to the workflow
      • View the workflow history
      • View workflow comments
    • View budget information in a chart
    • Open baseline, comparative, or opening balance data
    • Review the budget or forecast
      • Add and view cell comments
      • View and restore the cell history
      • View the audit log
      • Compare actuals, budgets and forecasts
    • Export a workbook or worksheet tab
    • Manage budgets and forecasts
      • Create a budget workbook
        • Filtered budget or forecast
        • Multi-currency budget
        • Unclassified data
        • Period types in budgets
        • Additional measures for driver-based budgeting
      • Create a forecast workbook
      • Clone a workbook
      • Import a budget or forecast
      • Edit the workbook setup
      • Roll a budget forward
      • Add more detail to a budget or forecast
      • Add worksheet tabs (drivers)
        • Balance Sheet and Cash Flow tabs
        • Manual Entry tab
        • Database tab
        • Headcount tab
          • Headcount tab FAQs
        • Reference tab
        • Lookup tab
        • Allocations tab
        • Scratch Pad tab
      • Manage worksheet tabs
      • Add notes to a workbook
      • Customize the format of measures
      • Manage the workflow
      • Manage user access and notifications
      • Publish a budget, forecast or other worksheet tab
      • Fix the baseline in a budget
      • Delete or restore a workbook
      • Delete a stream (Budgets & Forecasts)
      • Troubleshoot performance issues
  • Rebates
    • Overview of rebates
    • Get started with Rebates
    • Projects
    • Rules
      • Parent-child rebate rules
      • Rebates calculation methods
      • Yearly rebates
      • Quarterly rebates
      • Monthly rebates
      • Whole rule period rebates
      • Retrospective rebates
      • Pro rata rebates
    • Calculations
      • Run a calculation
      • Schedule calculations
      • View calculation results and transactions
      • Post calculation results
    • Seasonal calendars
    • Rebates analysis
    • Rebates near miss analysis
  • CRM
    • Overview of CRM
    • Agenda
    • Contacts
    • Accounts
    • Leads
    • Activities
      • Microsoft 365 Outlook calendar integration
    • Campaigns
    • CRM analysis
    • CRM administration
  • Favorites
    • Save a favorite
    • Manage favorites
    • Set a favorite as your default view
    • Use alerts
  • Dashboards
    • Use dashboards
    • Create a dashboard
    • Set a dashboard as your homepage
    • Manage dashboards
  • Administration
    • Overview of access to data (Administration)
    • Users
      • Add, update or delete a user account
        • User maintenance form
        • User permissions
      • Create a user template
      • Manage a user's database access and restrictions
      • Manage user passwords
      • Monitor user activity
      • Lock user accounts
      • Impersonate a user
    • Profiles
    • Folders (Administration)
    • Favorites (Administration)
    • Dashboards (Administration)
    • Subscriptions (Administration)
    • Periods (Administration)
      • Period types
      • Working days
    • Databases (Administration)
    • Sync Sources
    • Connectors
    • Configuration
      • Set up SSO
      • Set up SSO with Microsoft Entra ID
    • Logs
    • Designer
      • Modify a database
      • Get your data into Phocas
      • Design a database
        • Create a database
        • Add (connect) data to a database
        • Map data to the database
        • Save your database design
      • Design a financial database
      • Build a database
      • View and revert to older design versions
      • Add a budget file to a financial database
      • Add a budget file to a non-financial database (easy budget upload)
    • Sync
      • Automatically join or split items during Sync (split view)
      • Schedule the sync process
      • Migrate Sync
      • Test the sync process
    • Reserved words and characters
    • End of year maintenance tips
  • OTHER INFORMATION
    • File upload
    • Encrypt (share secrets)
    • Glossary
    • Release notes
      • Analytics release notes
      • Financial Statements release notes
      • Budgets and Forecasts release notes
      • Rebates release notes
      • Administration release notes
    • System requirements
    • Technical limitations
    • Security information
    • Scheduled upgrade and maintenance periods
    • More help and support
Powered by GitBook

© Phocas Software

On this page
  • Create a group
  • Expand or collapse a group
  • Spread totals within a group
  • Ungroup columns

Was this helpful?

  1. Budgets & Forecasts
  2. Customize your view (Budgets & Forecasts)

Group period columns

Group several period columns in a worksheet into one column that displays the total of value.

PreviousFilter a worksheet (search for items)NextUse layouts

Last updated 7 months ago

Was this helpful?

User permission: Budgets & Forecasts

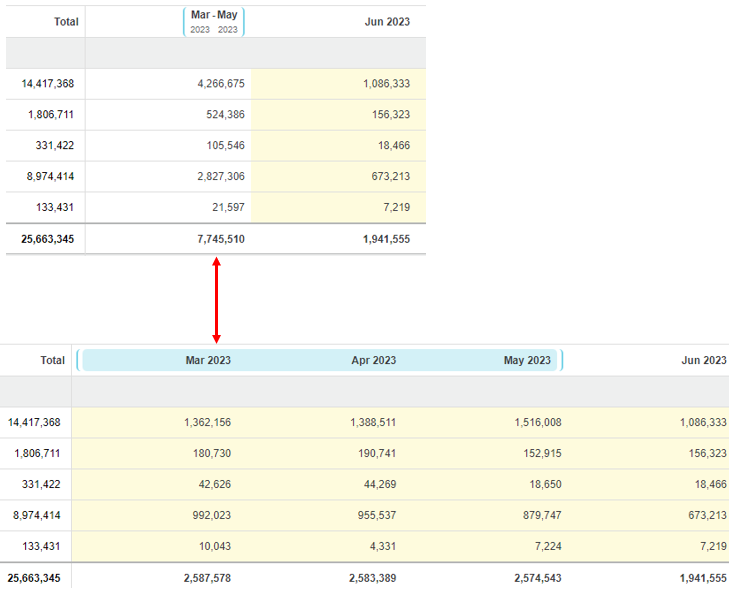
The column header of the period column group identifies the periods (columns) in that group. The values you see in a period column group are the total of the values in the individual periods.

There are many reasons why you might want to group columns, such as to:

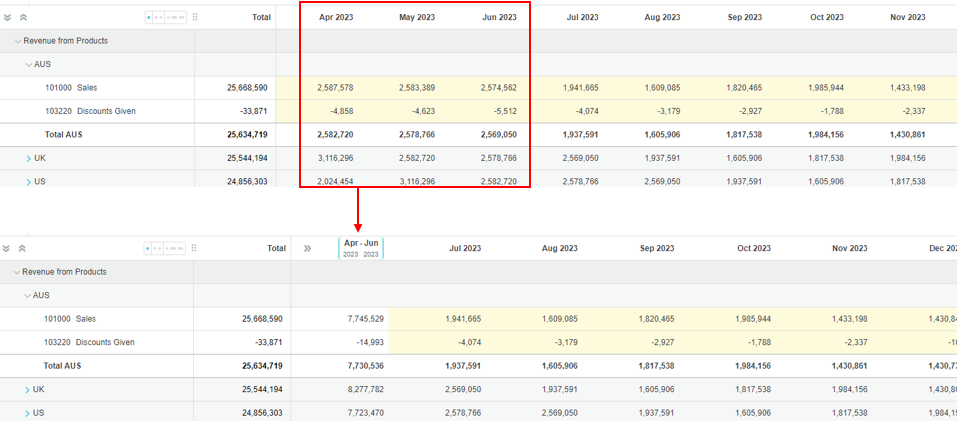
  • Group past periods into one summary column, so that data is hidden from view and you can focus on the remaining months in the budget period.

  • Group a couple of weeks together to view a fortnightly budget.

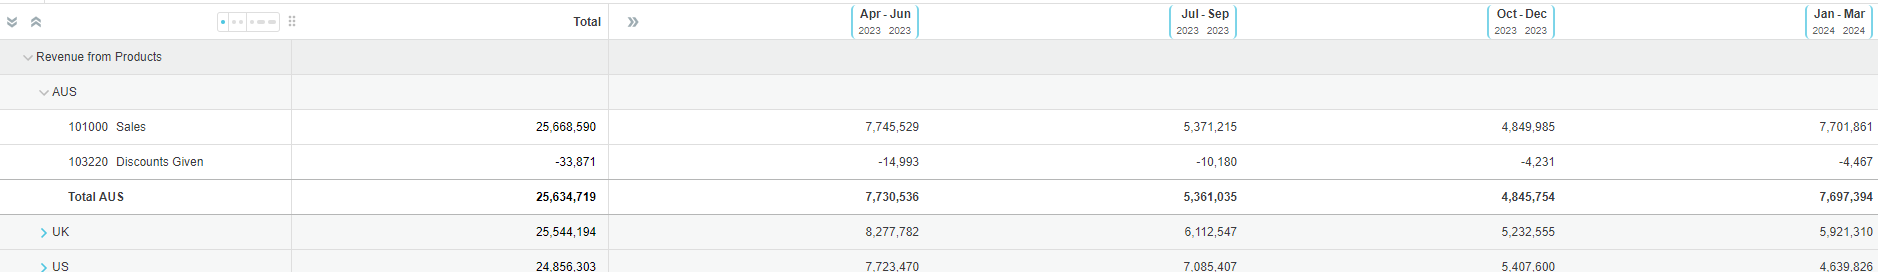
  • Group three months together to get a summary total of the budget values in that quarter.

  • View your budget values at a summary time period level, such as quarters, and avoid the need to scroll across the worksheet.

Create a group

If you are the budget owner and you create column groups, the groups display initially in a ‘collapsed’ state for you; you cannot edit the values in the cells (white background). However, you can use the spread feature to change the total value. When contributors open the workbook, they will see those groups in the expanded state (yellow background), so they can edit the values (according to the workflow).

Contributors also have the ability to create column groups, to meet their data entry needs. These changes do not impact the column groupings set by the budget owner.

Column groups are retained the next time you (budget owner and contributors) load the workbook. However, they are removed when you copy a budget forward or change the start or end dates.

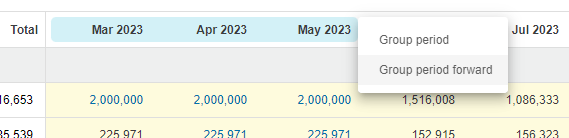
  1. Click the header of the first period column you want to include in the group > hold and drag your mouse across the headers of the other columns you want to include in that group > release your mouse. The headers of the selected columns are highlighted blue and the grouping menu displays.

  2. Select the required grouping method:

    • Click Group period to group the selected period columns into one ‘total’ column. You can repeat this action manually for other periods in the worksheet

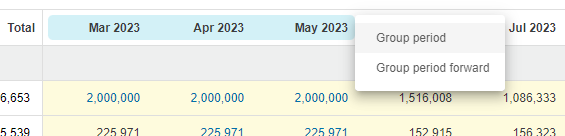
    • Click Group period forward to group the selected period columns into one ‘total’ column and group the subsequent period columns in the same way. This quickly creates a batch of ‘repeating’ column groups based on the number of period columns in the first group.

Expand or collapse a group

To view the period columns within a group, click the header of the group to expand the group. You can then edit the values as usual (yellow background) if you have been assigned tasks in the workflow.

Click anywhere in the blue highlighted column header area to collapse the group and view the group total again.

Spread totals within a group

Ungroup columns

Right-click anywhere in the blue highlighted column header area and click Ungroup period to ungroup that group, or click Ungroup all to remove all groupings.

In the collapsed state, you can use the feature to change the total values of a group and spread it across the periods within that group.
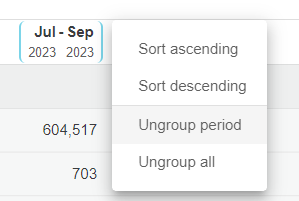
spread