Use comparison rows
Add comparison rows to your worksheets to view comparative data alongside your budget data and help you edit those values. This information can be used in formulas or just for reference purposes.
User permission: Budgets & Forecasts
In the Main tab, Database tab, and Reference tab, you can add a comparison row based on a stream in the corresponding database, such as last year's actuals, last year's budget, the current year's forecast, and so on. The comparison row includes the percentage difference between the budget values and the comparison row values. You can then drill down into the underlying transactions to take your analysis further.
If you have permission, you can customize the comparison setup and add more comparison rows, to get the best comparisons to meet your organization’s needs.
Budget owners and administrators can edit the comparison setup.
View a comparison row
View a comparison row for a budget row using one of these methods:
Hover over the border line on the left of the Total column and click the Comparison button that displays.

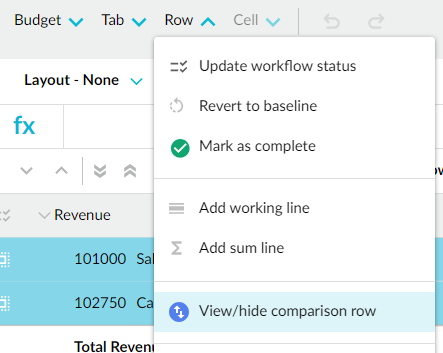
Select the row(s) and click the Row menu > View/hide comparison row. This method is handy when you want to view comparison data for one or more specific rows.

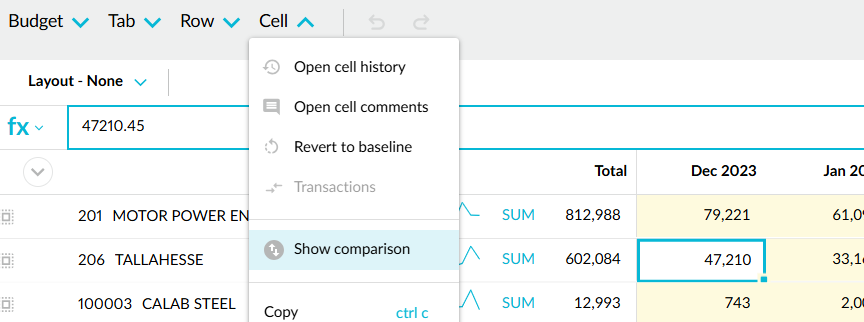
Either click the cell and click the Cell menu > Show comparison or right-click the cell and click Show comparison. This method is handy when you want to quickly view comparison data for a specific cell.

Click the Expand all comparison rows button in the grid header to expand all rows in the worksheet.
The comparison row appears underneath the budget row, displaying data from the comparison stream. By default, the comparison row is based on your budget workbook setup. If you have not yet adjusted any budget values, the comparison and budget values will be the same, so the comparison row shows the difference as 0%. As you adjust your budget values, the difference percentage in the comparison row updates accordingly.
The formula used to calculate the comparison percentage is: (budget value - comparison value) / comparison value

To hide one comparison row, click its Comparison button. To hide multiple comparison rows, select the parent row(s) and click the Row menu > View/hide comparison row.
View comparison data transactions
The ability to view all transactions is limited by your access to financial data. If you have permission to manage custom statements, you can restrict users from accessing transactions in specific accounts.
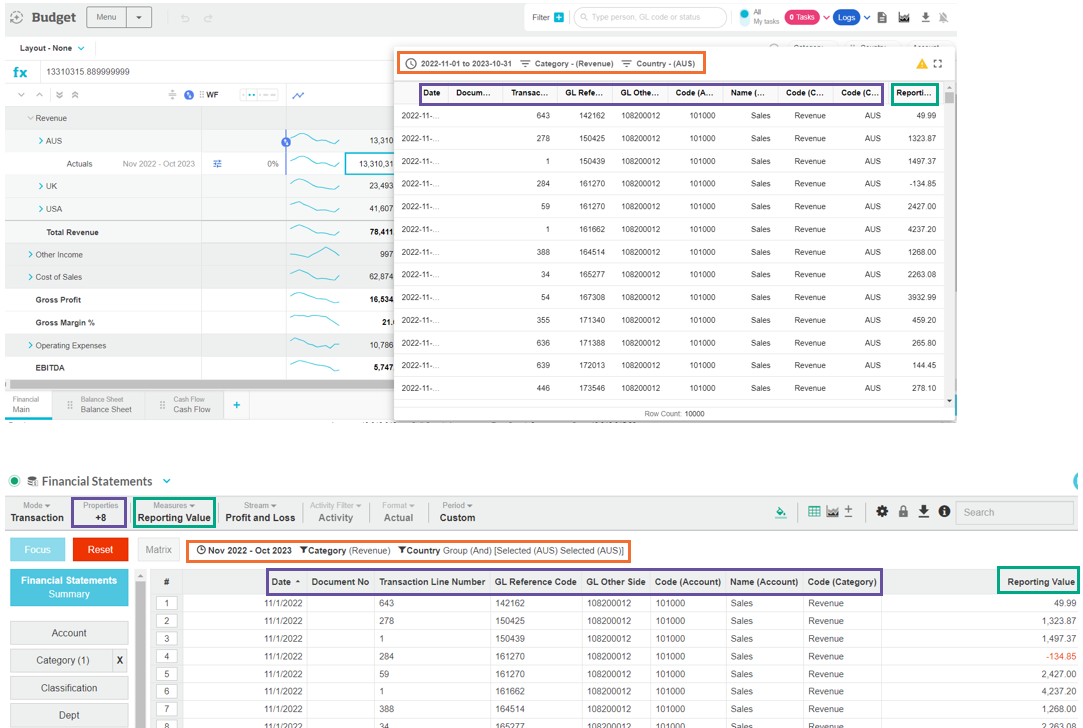
Either click the cell and click the Cell menu > Transactions or right-click the cell and click transactions. The transactions window displays all the transaction values associated with the selected value; the sum of these transaction values equates to the value you see in the worksheet cell. This is the same data that you see when you view the transactions in the database, via either Financial Statements or Analytics, as applicable. Regardless of the starting point, the transactions display in Analytics > Transaction mode. In the top-left corner, you can see the period followed by the filters that are applied. In the grid, there are columns for all the properties, along with the value, which corresponds to the selected measure. There’s a count of rows at the bottom. If a row limit is applied in Analytics, it is carried through into the Budgets & Forecasts transaction window, as identified by the warning symbol in the top-right corner.

You can then:
Click a column header to sort the transactions in that order.
Click the full-screen button in the top-right corner to get a better view of the transaction grid.
Click outside the transaction window to close it and return to the worksheet.
Last updated
