LogoLogo
More help and supportPhocas website
  • Home
  • Getting started
    • Navigation
    • Homepage
    • Data access
    • User licenses, profiles and permissions
    • Account settings
    • Databases
    • Periods
      • Offset dates
      • Default period for a database
    • Sharing and folders
      • Share a dashboard, favorite, or alert
    • Subscriptions
  • Analytics
    • Take a tour of Analytics
    • Work with the grid
    • View a summary of the data
    • Customize your view (Analytics)
      • Change the mode
        • Period mode
        • Period Variance mode
        • Period Stream mode
        • Moving mode
        • Stream mode
        • Total mode
        • Transaction mode
        • Matrix mode
        • Matrix Variance mode
        • Matrix Share mode
        • Variance mode
        • Search mode
        • Market mode
        • Custom mode
      • Change the properties (Analytics)
      • Change the measures (Analytics)
      • Change the stream
      • Use the activity filter
      • Change the data format
      • Change the period (Analytics)
    • Drill down into your data (view transactions)
    • Filter data (use dimensions)
    • Select data (Analytics)
    • Focus on data (Analytics)
    • Copy or export data
    • Search for data
      • Perform a basic search
      • Perform an advanced search
      • Search for similar or comparative data (right-click filter)
    • Add levels to the grid (grid nesting)
    • Compare data with Matrix mode
    • Get more options for viewing data
    • Visualize your data in a chart
      • Bar and Column charts
      • Combo chart
      • Pareto chart
      • Waterfall chart
      • Line chart
      • Area and % Area charts
      • Pie and Donut charts
      • Bubble chart
      • Radar chart
      • Gauge chart
      • Bullet chart
      • Summary and Ring Summary charts
      • Map charts
      • Configure the chart options
      • Select and focus on a chart segment
      • Export a chart as an image
      • Use the chart legend
    • Save favorites and add to dashboards (Analytics)
    • Reset data
    • Phocas AI
    • Flex Modes
      • Switch modes
      • Filter data (Flex Modes)
      • Apply conditional formatting
      • Add levels to the grid (Flex Modes)
      • Manage columns (Flex Modes)
      • Save and share a favorite (Flex Modes)
      • View your data in a chart (Flex Modes)
  • Financial Statements
    • Take a tour of Financial Statements
    • Overview of access to financial statements
    • Customize your view (Financial Statements)
      • Change the properties (Financial Statements)
      • Change the measures (Financial Statements)
      • Change the period (Financial Statements)
      • Change the current data
      • Change the budget data
      • Change the columns
      • Change the style
      • Change the rows (activity filter)
    • Filter the financial information
    • Select and focus on data (Financial Statements)
    • Copy or export financial information
    • Add a level in a financial statement
    • View financial information in a matrix (change column groups)
    • Add and view comments (Financial Statements)
    • View transactions (Financial Statements)
    • View financial information in a chart
      • Create a Pie and Donut chart (Financial Statements)
      • Create a Value card
      • Export a financial chart widget as an image
    • Save and share favorites (Financial Statements)
    • Add financial analysis to a dashboard
    • Manage financial statements
      • Overview of financial statements and dimensions
      • Create a financial statement
      • Delete a financial statement
      • Customize a financial statement
        • Rename a financial statement
        • Reorder a financial statement
        • Customize account groups
        • Customize calculations
          • Functions for Profit & Loss calculations
          • Formulas for financial ratios
        • Customize headings and spacers
        • Set the revenue row in a Profit & Loss statement
        • Customize columns
        • Customize a Cash Flow statement
          • Common account mapping for Cash Flow statements
        • Rebuild the database
      • Set the financial year end date
      • Map the Retained Earnings account(s)
      • Restrict access to accounts
      • Manage budget streams (Financial Statements)
        • Create a budget (Financial Statements)
      • Use statistical streams
      • Use multiple currencies
      • Manage dimension groups
      • Map categories from your Chart of Accounts
  • Budgets & Forecasts
    • Overview of key terms and concepts
      • Budgets versus forecasts
      • Users and data access
      • Relationship with the Financial Statements module
      • 3-statement budgeting
      • Filtering methods
      • Demand planning
      • Loan repayments
    • Take a tour of Budgets & Forecasts
      • Explore the budget workbook
      • Explore the forecast workbook
      • Explore the Balance Sheet and Cash Flow budgets and forecasts
    • Customize your view (Budgets & Forecasts)
      • Filter a worksheet (search for items)
      • Group period columns
      • Use layouts
    • Use session filters
    • Edit values in a worksheet
      • Open workbook notes
      • Use keyboard shortcuts
      • Copy and paste values
      • Use comparison rows
      • Use sum and working lines
      • Use formulas
      • Spread totals
      • Revert to the baseline values
      • Edit the Balance Sheet budget
      • View and use headcount data
    • Refresh a workbook
    • Use workflows
      • Contribute to the workflow
      • View the workflow history
      • View workflow comments
    • View budget information in a chart
    • Open baseline, comparative, or opening balance data
    • Review the budget or forecast
      • Add and view cell comments
      • View and restore the cell history
      • View the audit log
      • Compare actuals, budgets and forecasts
    • Export a workbook or worksheet tab
    • Manage budgets and forecasts
      • Create a budget workbook
        • Filtered budget or forecast
        • Multi-currency budget
        • Unclassified data
        • Period types in budgets
        • Additional measures for driver-based budgeting
      • Create a forecast workbook
      • Clone a workbook
      • Import a budget or forecast
      • Edit the workbook setup
      • Roll a budget forward
      • Add more detail to a budget or forecast
      • Add worksheet tabs (drivers)
        • Balance Sheet and Cash Flow tabs
        • Manual Entry tab
        • Database tab
        • Headcount tab
          • Headcount tab FAQs
        • Reference tab
        • Lookup tab
        • Allocations tab
        • Scratch Pad tab
      • Manage worksheet tabs
      • Add notes to a workbook
      • Customize the format of measures
      • Manage the workflow
      • Manage user access and notifications
      • Publish a budget, forecast or other worksheet tab
      • Fix the baseline in a budget
      • Delete or restore a workbook
      • Delete a stream (Budgets & Forecasts)
      • Troubleshoot performance issues
  • Rebates
    • Overview of rebates
    • Get started with Rebates
    • Projects
    • Rules
      • Parent-child rebate rules
      • Rebates calculation methods
      • Yearly rebates
      • Quarterly rebates
      • Monthly rebates
      • Whole rule period rebates
      • Retrospective rebates
      • Pro rata rebates
    • Calculations
      • Run a calculation
      • Schedule calculations
      • View calculation results and transactions
      • Post calculation results
    • Seasonal calendars
    • Rebates analysis
    • Rebates near miss analysis
  • CRM
    • Overview of CRM
    • Agenda
    • Contacts
    • Accounts
    • Leads
    • Activities
      • Microsoft 365 Outlook calendar integration
    • Campaigns
    • CRM analysis
    • CRM administration
  • Favorites
    • Save a favorite
    • Manage favorites
    • Set a favorite as your default view
    • Use alerts
  • Dashboards
    • Use dashboards
    • Create a dashboard
    • Set a dashboard as your homepage
    • Manage dashboards
  • Administration
    • Overview of access to data (Administration)
    • Users
      • Add, update or delete a user account
        • User maintenance form
        • User permissions
      • Create a user template
      • Manage a user's database access and restrictions
      • Manage user passwords
      • Monitor user activity
      • Lock user accounts
      • Impersonate a user
    • Profiles
    • Folders (Administration)
    • Favorites (Administration)
    • Dashboards (Administration)
    • Subscriptions (Administration)
    • Periods (Administration)
      • Period types
      • Working days
    • Databases (Administration)
    • Sync Sources
    • Connectors
    • Configuration
      • Set up SSO
      • Set up SSO with Microsoft Entra ID
    • Logs
    • Designer
      • Modify a database
      • Get your data into Phocas
      • Design a database
        • Create a database
        • Add (connect) data to a database
        • Map data to the database
        • Save your database design
      • Design a financial database
      • Build a database
      • View and revert to older design versions
      • Add a budget file to a financial database
      • Add a budget file to a non-financial database (easy budget upload)
    • Sync
      • Automatically join or split items during Sync (split view)
      • Schedule the sync process
      • Migrate Sync
      • Test the sync process
    • Reserved words and characters
    • End of year maintenance tips
  • OTHER INFORMATION
    • File upload
    • Encrypt (share secrets)
    • Glossary
    • Release notes
      • Analytics release notes
      • Financial Statements release notes
      • Budgets and Forecasts release notes
      • Rebates release notes
      • Administration release notes
    • System requirements
    • Technical limitations
    • Security information
    • Scheduled upgrade and maintenance periods
    • More help and support
Powered by GitBook

© Phocas Software

On this page
  • Adjust the opening balance
  • Add a working or adjustment line
  • Adjust the mini driver rows
  • Next steps
  • Publish a Balance Sheet budget
  • View the Balance Sheet (and Cash Flow) budget in Financial Statements

Was this helpful?

  1. Budgets & Forecasts
  2. Edit values in a worksheet

Edit the Balance Sheet budget

Learn about the unique characteristics of a Balance Sheet budget that impact the editing process.

PreviousRevert to the baseline valuesNextView and use headcount data

Last updated 3 months ago

Was this helpful?

User permission: Budgets & Forecasts

Related pages

  • (for budget owner and administrators)

Typically, you edit the Balance Sheet budget in the same way you edit the main budget, which means you can enter new values into any of the yellow cells and use formulas to calculate values and reference other cells and tabs. However, the Balance Sheet budget has some unique characteristics:

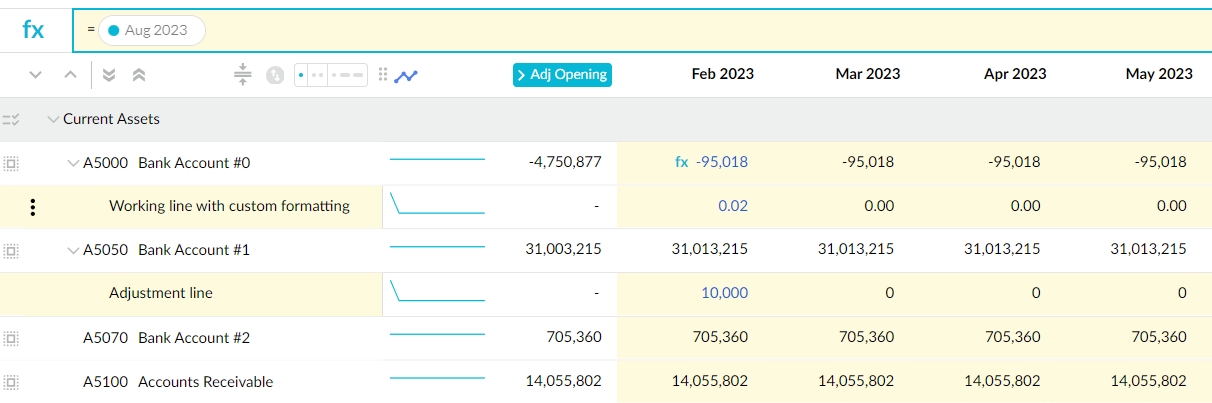
  • You will notice that the values in most account rows look the same across the periods. This is what keeps the Balance Sheet in balance.

  • There are some accounts in which the values always move in each period:

    • Cash (the account you selected in the budget setup) - Adjusts with any movements in the Balance Sheet.

    • Retained Earnings (the account you selected in the budget setup) - Adjusts with the movements in the profit in the Profit and Loss budget (Main tab).

    • If mini drivers were added to the Balance Sheet setup, the respective account rows also show movements in their values.

  • When you edit a cell in a Balance Sheet budget, the values in the period cells to the right of that cell update accordingly. You will also see movement in the Cash account row and, if you opted to create a Cash Flow budget, you will see your changes there too.

  • There are different ways to edit the values, giving you the flexibility to update the budget to respond to changes. These methods are: adjust the opening balance amount, add an adjustment row, and update mini drivers.

You cannot edit the Cash Flow budget, as it is derived from the Profit and Loss and Balance Sheet budgets. Any changes you make to those two budgets are automatically reflected in the Cash Flow budget.

Adjust the opening balance

  1. Click the Adj Opening button to display the Adjustments column.

  2. Expand the row in which you want to enter the adjustment.

  3. Enter the adjustment (value) into the Adjustment cell in the required row and press Enter.

Watch the video in the introduction above for an example of how to adjust an opening balance.

Add a working or adjustment line

Use working or adjustment lines to add extra detail to the account (parent) rows on your Balance Sheet.

Adjustment lines are unique to the Balance Sheet budget but work in a similar way to the sum line that’s available in most other types of tabs. They’re suitable for modeling unfrequent events, such as the purchase of a new asset or the early repayment of a loan. They’re also useful when you want to budget at a more granular level than the account level. You enter values or formulas into the adjustment row, and the values in the account row update automatically. A hidden sum line sits under the adjustment row, which references the column on the left, and as a result, the values in all the columns to the right update automatically. Watch the video in the introduction above for an example of how to add an adjustment row and see its impact, or follow the basic steps below.

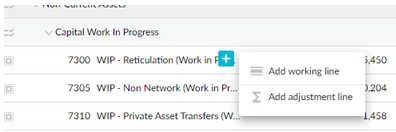
  1. Locate the account row for which you want to add the working or adjustment line.

  2. Hover over the account name, click the blue Add button, and select Add working line or Add adjustment line as required. The new line displays underneath the account row.

  3. Click in the new line under the account name and enter a name for the adjustment row.

  4. Proceed to enter the values or formulas in the applicable period cells.

Adjust the mini driver rows

Expand the row containing the mini driver, enter the new value into the applicable mini driver cell, and press Enter.

This video shows how the use of a stock (inventory) mini driver automatically drives movement in the Balance Sheet and how a change to its value directly impacts the cash movement.

Next steps

As with other types of budgets, when your Balance Sheet budget is complete, you can publish it to a stream to make it available in Financial Statements.

Publish a Balance Sheet budget

View the Balance Sheet (and Cash Flow) budget in Financial Statements

As the Balance Sheet stream uses balance brought forward logic, the opening balance is published along with the movements for the period, so you can view the Balance Sheet position at the relevant date in Financial Statements.

When you link the Profit and Loss and Balance Sheet budgets in a budget package in Financial Statements, the Cash Flow budget is derived automatically for you.

Working lines are a standard feature available in most other types of tabs. They are suitable for entering additional data for information purposes or for referencing in formulas in the account row. You can edit the measure format of the working line to include a prefix or suffix and determine the number of decimal places of the values. See for more information on how these lines work or follow these basic steps below.

are unique to the Balance Sheet budget and need to be added to the Balance Sheet setup. They are suitable when you have certain KPIs you want to watch, often based on complicated formulas. You adjust the values in the mini driver rows and the inbuilt formulas update accordingly.

In addition to publishing the Main tab, you must publish your Balance Sheet budget as a separate stream in the underlying database. See .

After you publish the Balance Sheet budget as a stream, you can add it to a budget package in Financial Statements. See (in Financial Statements).

Use sum and working lines
Publish a budget workbook
Manage budgets
Overview of 3-statement budgeting
Explore the Balance Sheet and Cash Flow budget
Add a Balance Sheet tab and Cash Flow tab
Mini drivers
image-20240521-205236.png
image-20240521-211833.png