
Functions for Profit & Loss calculations
Learn about the inbuilt functions you can use in the Profit and Loss statement calculations.
See also Formulas for financial ratios.
[acc]
Watch this PUG Training video: Cashflow - direct and indirect (jump to 23.00)
The Account [acc] function references a single account code, allowing you to insert the values of an account, rather than a group, into a financial statement. This function respects the values as displayed on the statement. For example, if the Reverse Sign option is applied to a Revenue group to present values as positive, a referenced Revenue account will also be positive.
There is no account lookup for this function, so you need to have the account code at hand. Also, you can only reference accounts that are in the underlying financial statement.
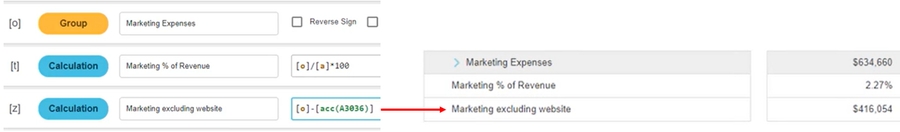
In square brackets, enter the keyword acc and the account code in round brackets, for example [acc(A3036)].
Example: Exclude an account from the marketing expenses group in a Profit and Loss statement
Suppose you want to display the value of the Marketing Expense excluding the Website Expense (account code A3036) in the Profit and Loss statement. Add a calculation row with a reference to the Marketing Expense row less the new function referencing the website expense account code [acc(A3036)].
[bal]
Watch these PUG Training videos: Ratios and statistical streams (jump to 03.29) and Cashflow - direct and indirect (jump to 23.00)
The Balance [bal] function references the Balance Sheet, allowing you to select Balance Sheet entities to include in calculations on the Profit and Loss statement, which is useful for calculating financial ratios.
In square brackets, enter the keyword bal, select the account group from the list that displays, then select the Balance Sheet item parameter (average, closing or movement).
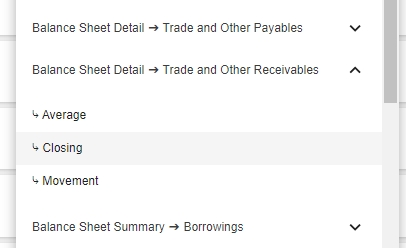
The function is automatically completed for you, for example [bal(Balance Sheet Detail, Trade and Other Receivables, closing)].

Average balance
The average parameter calculates an average of the Balance Sheet account group based on the start date (opening balance) and end date (closing balance) of the period in the Profit and Loss statement. For example, if Current Assets are included in a Profit and Loss statement for the period January to June, the [bal] function will average the Current Asset values as at the end of December (opening balance) and as at the end of June (closing balance).
Enter the [bal] function as outlined above, then manually enter average before the closing round bracket.

Closing balance
The closing parameter inserts the final position of the Balance Sheet account group based on the start and end dates of the period in the Profit and Loss statement. For example, if Current Assets are included in a Profit and Loss statement for the period January to June, the [bal] function will average the Current Asset values as at the end of December and as at the end of June. This calculation takes into account any material movements in Balance Sheet groups during that period.
Enter the [bal] function as outlined above, then manually enter , closing before the closing round bracket.

Balance Sheet account movement
The Movement paramater displays the difference between the Balance Sheet group value at the start of the period and the value at the end of the period. For example, if January 2023 = 50 and March 2023 = 150, the movement is 100.

[DaysInPeriod]
The [DaysInPeriod] function inserts the number of days in the period associated with the financial statement, allowing you to calculate the revenue per day, profit per day, and so on. You can multiply the days by 365 to produce an annualized result.
In square brackets, enter the keyword day, then click the Number of days in period message that displays.
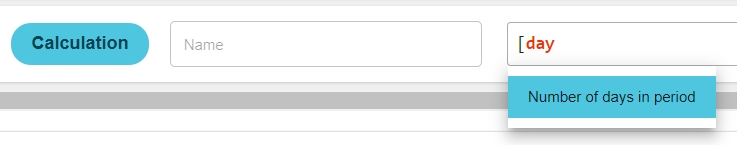
The function is automatically completed for you and you can proceed to use it alongside other functions, for example:


[stat]
The Statistics [stat] function inserts the sum of a measure from a statistical stream, allowing you to calculate revenue or operating profit per customer, or other business insights by combining statistical (non-financial) streams with financial information.
This function is only applicable if your organization has statistical streams added to a database. Your administrator can add non-financial streams to your financial database using Designer.
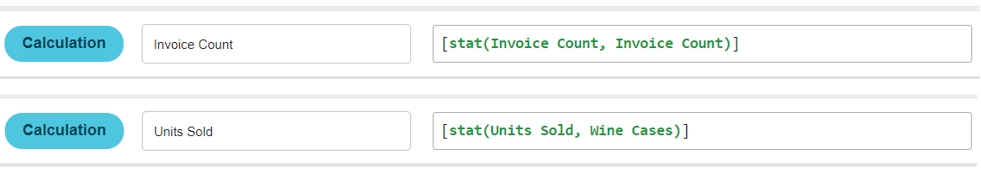
In square brackets, enter the keyword stat, then select the stream and measure combination from the list that displays.
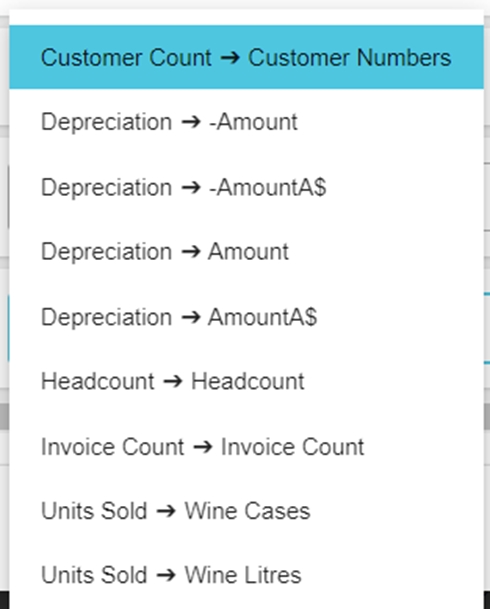
The function is automatically completed for you. It includes the stream followed by the measure, for example:
[avg]
The Average [avg] function inserts the average of the values in a measure from a non-financial stream, for a specific period. For example, if you want to know the average number of units sold during the year (monthly basis), the [avg] function will calculate the average of the monthly balances.
This function is only applicable if your organization has non-financial streams added to a database. Your administrator can add such streams to your financial database using Designer.
In square brackets, enter the keyword avg, then select the stream and measure combination from the list that displays. The function is automatically completed for you. It includes the stream followed by the measure, for example:

Last updated