Take a tour of Financial Statements
Learn about the homepage and key elements of Financial Statements.
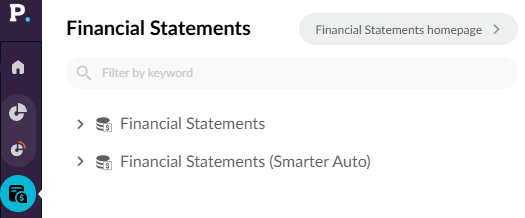
Your finance-related content items are accessible from both your Phocas homepage and the side navigation menu (in the Financial Statements, Recents, and Favorites menus). Financial Statements also has its own homepage.
Financial Statements homepage
Click Financial Statements in the Phocas menu, then click the Financial Statements homepage button in the top-right corner. To open the homepage in a separate browser tab, right-click the button and select Open link in new tab.

The Financial Statements homepage has many of the same features as your Phocas homepage, allowing you to sort and filter the grid or search for specific financial databases, statements, and favorites. There are two main tabs: Home and Data Entry.
Home tab
On the Home tab, your Financial Statements content items are organized into four subtabs. Click a tab above the grid to filter the list and see those items.
All: This tab opens by default and contains a list of all the Financial Statements-related items.
Databases: This tab contains a list of all your financial databases.
Statements: This tab contains a list of all the financial statements created against your financial databases. The Dimension group column identifies the dimension that drives each statement’s mapping.
Favorites: This tab contains a list of all the favorites saved against your financial databases.
Click an item in the grid to open it in the Financial Statements module.

Data Entry tab
The Data Entry tab is where you view and manage journals and create new ones. This tab contains two key elements:
A grid containing a list of all your journals.
You can filter and sort the list of journals the same way as the items on the Home tab.
The Journal number column identifies the number of the journal. Each database has its own number set. For example, you might have two journals numbered 1, but they’ll be in separate databases. If you delete a draft journal, that number no longer exists.
The Status column identifies the current status of the journal. This can be Draft, Published, Reversed, Reversal, or Draft reversal.
The Create journal button in the top-right corner.

Financial Statements module
Financial Statements has the following key elements, as identified by the numbers in the image.

The grid is where you view and analyze the information from the selected financial statement.
Rows
Color-coding helps you differentiate the information that's displayed:
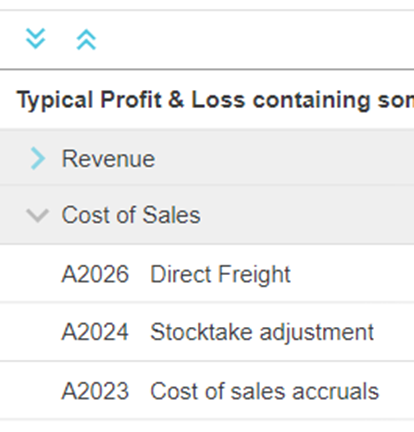
Grey rows: These rows are the categories (groups of accounts), like Revenue and Expenses in a Profit and Loss or Assets and Liabilities in a Balance Sheet.
You can expand these rows to view the underlying accounts and drill down into individual transactions.

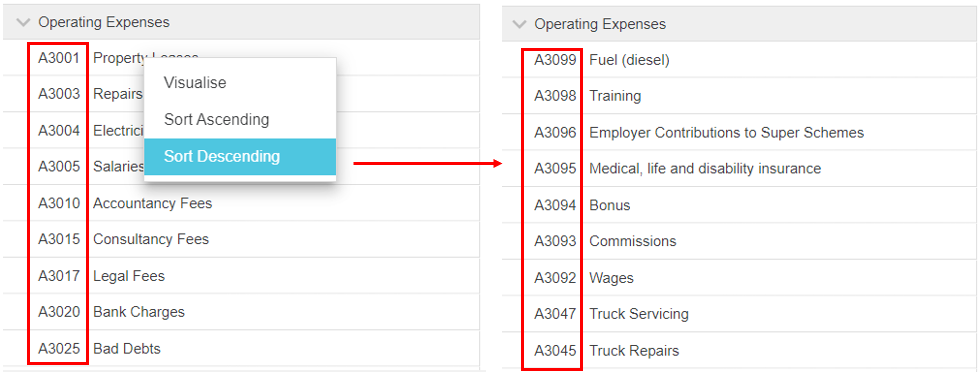
Expanded statement category showing underlying accounts By default, the General Ledger accounts within the groups are displayed in ascending code order. You can switch between descending and ascending sort order as required. When the groups are expanded, right-click any row within a group and click Sort Ascending or Sort Descending. Even if you change the sort order for a particular group, for consistency purposes, the accounts in all groups are sorted in the same way.

Sort Ascending and Sort Descending options in the grid If you have a Suspense row at the bottom of the statement, it means there are one or more new accounts that haven't yet been mapped to the applicable category in the statement.
White rows: These rows are the calculations, for example, Total Revenue. These rows can be a combination of different groups or other calculations, such as ratios, to create an end result. You can hover over the fx symbol to view the formula used in the calculation. These rows aren't expandable and don't have transactions.
Columns
First, there's the column showing the name of the category, account, or calculation, as applicable. Then you typically have columns showing data for the Current period, Previous period, and Budget, followed by variance columns.
The dimensions panel on the left of the statement grid displays the list of dimensions in your underlying financial database.
Use these dimensions to change your view of the statement using the options listed below.
If you click a dimension, you move into the Analytics grid, where you can drill deeper into your data, all the way down into the transaction level.
If you're not working with dimensions and want a better view of the statement grid, click the Hide dimensions button at the bottom of the dimension list.
There are several options above the dimension list and statement grid:
Focus, Reset, and Summary buttons: Use the buttons to focus on specific entities within a dimension (rows in the grid), reset the grid to the default view, or return to the summary (high-level) view of the data.
Levels: Drag dimensions into the Levels drop zone to add them as levels in the grid, create a nested view of the information, and view the data at a more granular level. For example, add the Country dimension as a level to view the contribution of each country to the overall performance.
Column groups: Use the Column groups feature with selected dimensions to transform the grid into a matrix format and view the entities side-by-side. For example, select the Country dimension, then select three countries to view financial information for those countries in separate columns in the grid, alongside the combined information in the Total column.
Filters: Drag dimensions into the Filters drop zone, then select the desired items using the dropdown button. For example, add the Country dimension and select only the UK to filter the data and view only the UK's contribution to the overall performance.
The toolbar at the top has several menus that you can use to switch between your financial statements and customize your view of each one.
It also has the following action buttons:
Watch this PUG Training video: Financial Statements 101 (for users who manage the statements)
Last updated
