Drill down into your data (view transactions)
Move from the high-level Summary view of the data into the lower-level transactional detail to understand what is happening in your business.
Watch this Phocas Demo video: Drill down and follow your train of thought
Watch this Phocas Academy video: What did I sell yesterday? (using transaction mode)
The first step is to filter the data. You can then select and focus on specific data to deepen your analysis. You can repeat these steps and take other actions to deepen your analysis - you can drill all the way down into the transactions, viewing our data in Transaction mode.
As you drill down into the data, the number of records in the grid decreases. The filters you apply display across the top of the grid, so you can track where you are and follow your train of thought, all the way down until you find the answers to your questions.
The following two examples outline how you can use a combination of the Analytics features to drill down into your data. You can find detailed instructions in the related pages.
Example 1: Answer a question - what is the reason for the decrease in sales revenue?
You are analyzing your Sales database and see there is a decrease in revenue compared to last year. Firstly, you want to find out which Sales Reps are performing worse this year compared to last year.
Click the Sales Rep dimension to filter the data by Sales Rep.
Click Mode > Variance to change the grid into Variance mode.
Click the Variance column two times to sort the data by the variance in descending order.

You have identified the Sales Reps, now you want to know what key products are involved.
Select the rows of those Sales Reps, for example the top six.

Click the Item Class (Product) dimension.
You identified the products, now you want to know which customers are involved.
Select the rows of those products, for example the top two.
Click the Customer dimension.
At this stage, you have applied two filters to the data and are looking at a third dimension.

You have identified the customers but you want to take a closer look at those with the lowest sales.
Select the rows of those customers, for example the top three, then click the Focus button.

Click Mode > Transaction.
You can now see the transactions (lowest level of detail) for those customers, including the order and invoice numbers. But you need more information. Where are these customers based? Who is their Sales Rep?
Click Properties and select Territory (Region) and Sales Rep.
Click Measures and select Quantity and Local Margin.

You have added columns to the grid to get even more information, so now you can examine the data. For example, you might want to sort by Quantity or Margin in descending order, to see which Sales Rep is making the lowest quantity transactions or earning the lowest margin per sale.
You found the answer to your question - it’s time to take action. You can speak to the Sales Reps in question to find out what’s happening. Perhaps you need to manage their performance or initiate a new sales strategy.
Example 2: Get insights on customers to see if their pattern of behavior is changing
You want to find out if there are any customers whose pattern of behavior is changing, in particular, declining monthly sales (buying less products month on month). Firstly, you want to find out if there are any such customers.
Ensure the grid is in Period mode (click Mode > Period).
Click the Customer dimension to filter the data by customer.
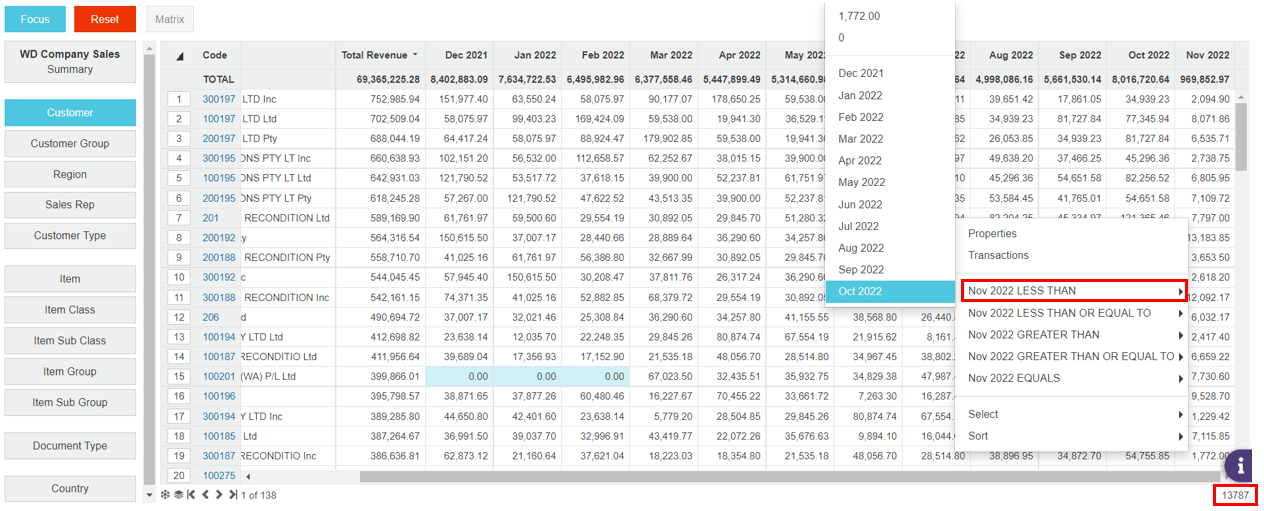
You have over 13,700 customers, so you need to narrow down the list before you can find the pattern of behavior. You can filter the data in the grid by condition.
Scroll across to the November (current month) column and right-click > Nov 2022 LESS THAN > Oct 2022.

Now the grid displays only the customers whose sales in November were less than in October (the previous month). You need to filter a few more times to find the pattern.
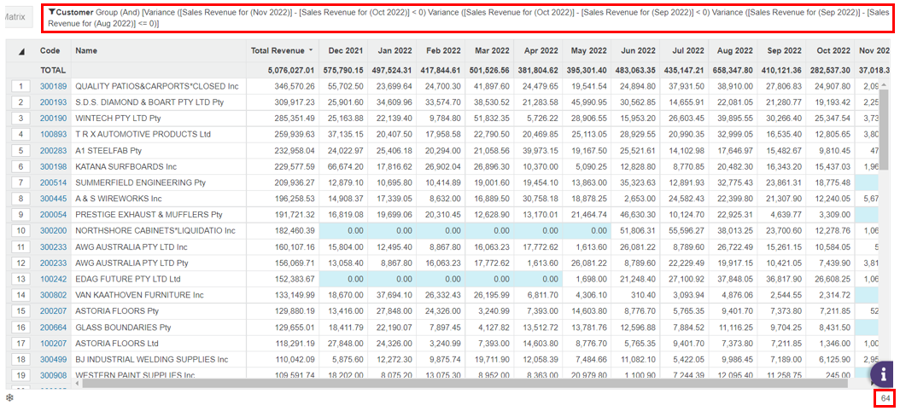
Right-click the October column and click Oct 2022 LESS THAN > Sep 2022. Now the grid displays only the customers whose sales are in November < October and October < September.
Right-click the September column and click Sep 2022 LESS THAN > Aug 2022. Now the grid displays only the customers whose sales are in November < October, October < September, and September < August.
You now have filtered the data to display a list of 64 customers that exhibit the behavior you are concerned about. The filters you applied display in the header above the grid.

Next, you want to find out what products are involved.
Click the Item Class (Product) dimension.
Select the top two products and click the Focus button.

You can now see a summary of sales for those two products in a trend over time but now you want to compare each customer side by side across those products.
Select the two product rows and click the Matrix button.
Click the Customer dimension.
You can now see the customers with their total sales, along with the sales for each of the two products.

From here, there are several paths you can take, for example:
You can browse the records in the grid to find customers whose product mix is off. For example, if customers typically buy the same amount of each product but one product value is higher than the other, the sales values are out of balance.
You can look for movements. Click Mode > Matrix Variance. For those customers, you can now see what the total change is from this year to last year and what the change is within each product class. Scroll through the data to identify substantial movements. For example, there might be customers whose sales are up overall but down in one product class. There might be customers whose sales are down overall and most of the decline is from one product class.
You got some insights into the behavior of your customers, it’s time to take action. You have the opportunity to interrupt this declining trend in sales now before it is too late and you lose the customers. You might want to change the current sales strategy or implement other initiatives to stimulate sales.
