Visualize your data in a chart
Transform your grid view into a chart view to visualize the data and see trends at a glance.
User permission: Query > Kind > Chart
Charts are particularly useful when the grid has a lot of data; rather than scrolling through multiple columns or rows, you can get a visual overview of the data instead. You can switch between different types of charts and configure how the data displays in each one. You can save the chart as a favorite or add it to a dashboard for quick access to the data insights.
Switch to chart view
You can switch from the default grid view to the chart view any stage during your analysis. The same information is presented in chart view; it is just in a different format. Click the Chart button in the top right toolbar above the grid. A default chart displays, with chart category buttons on the left.
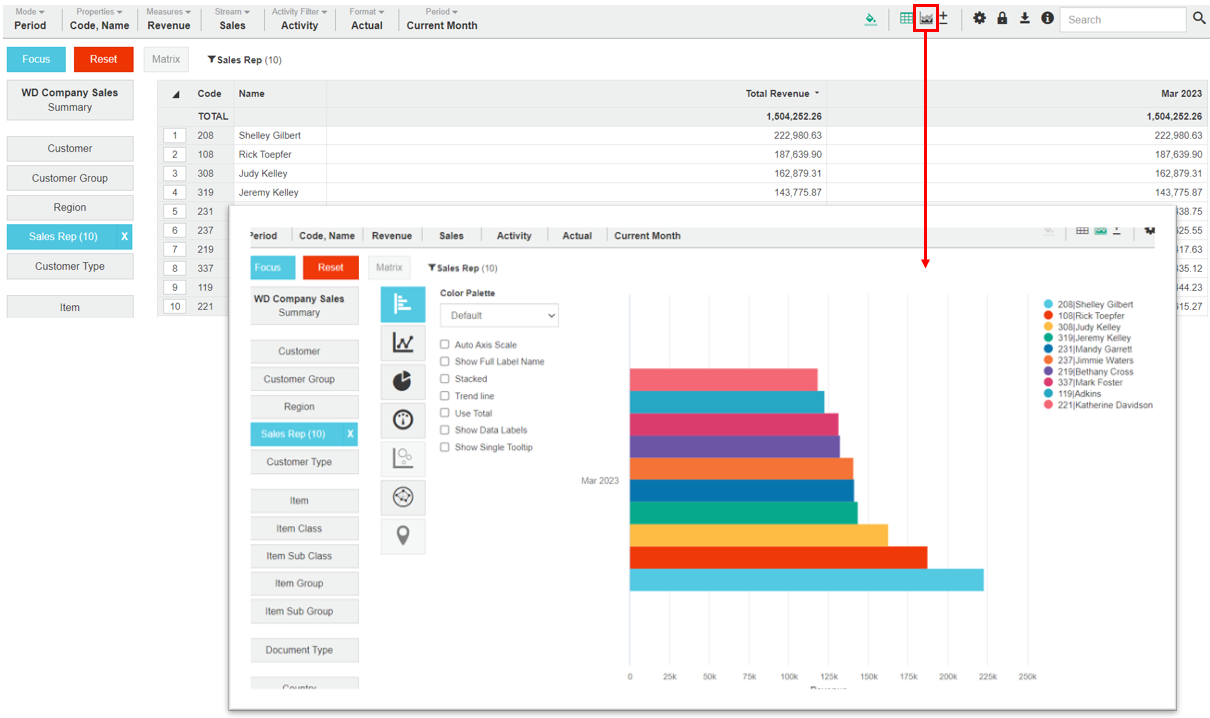
By default, only the first 50 rows of a grid are included in the chart. If you have a requirement for additional rows to be displayed, your Phocas consultant can assist with this. You can also display a sum instead of individual values (see Chart options).
Select a different type of the chart
In chart view, click a category button to view the chart type options, then click the chart you want to view.
The type of charts that are available during your analysis depend on:
The type of data you are viewing.
Whether you are in Summary view or a focused view (after selecting a dimension). During your analysis, you might want to return to the Summary view to get a more concise view of the data. Some charts, such as line chart, display best when they have less details.
The mode you have selected.
Other factors, such as the measures or properties you have selected.
The following table lists all the charts. As outlined above, some charts are only available in certain situations. Click the chart links for more detailed information and examples.
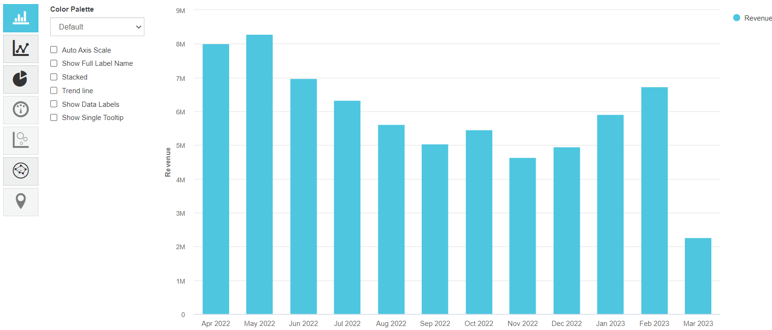
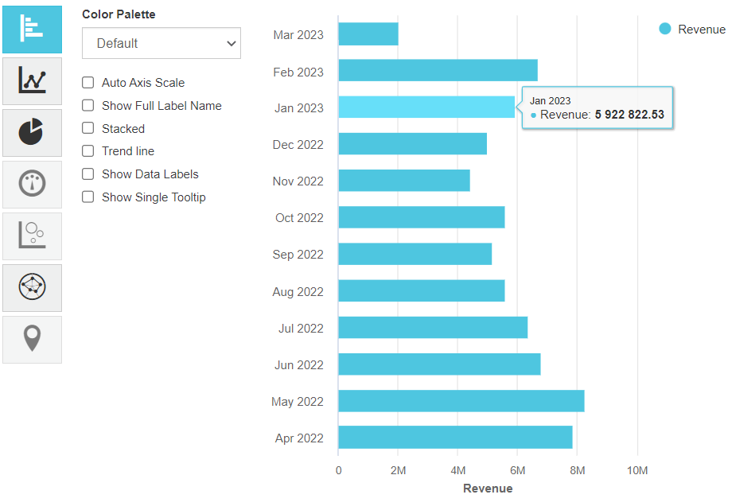
Displays several variables together, in horizontal bars.
Useful for displaying simple comparisons, such as revenue each month.
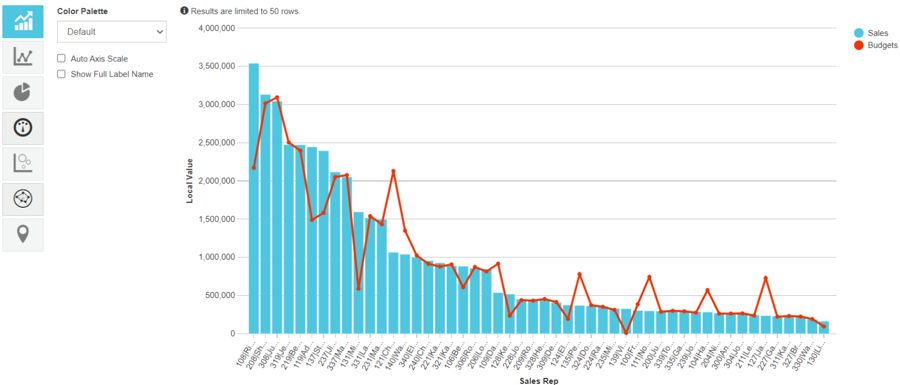
Displays a combination of a Column chart and Line chart.
Useful for making comparisons, such as sales vs budget.
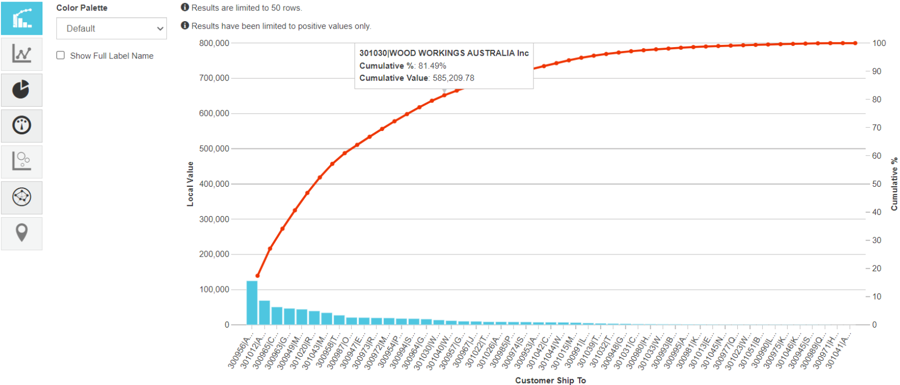
Shows the relative importance of differences between large sets of values.
Useful for root cause analysis.
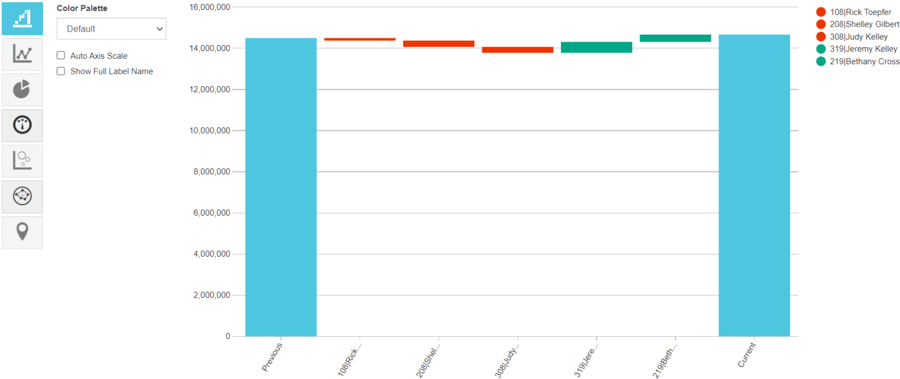
Displays an overview of positive and negative changes to a value over time.
Useful for getting a clear picture of growth or decline in performance, such as that if your Sales Reps.
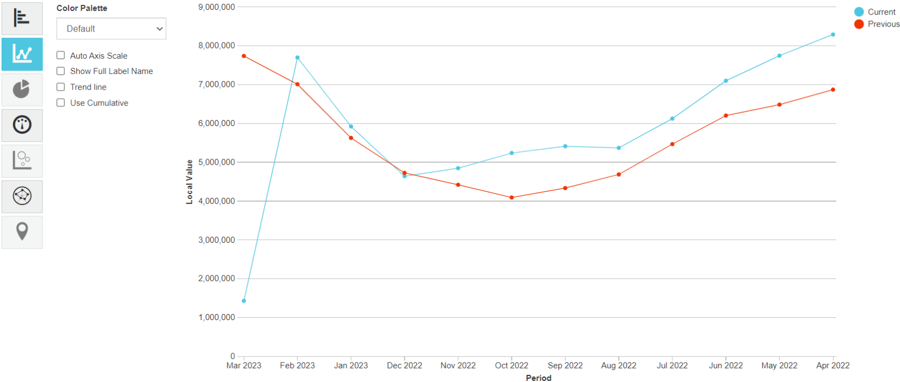
Plots performance over time.
Useful for making comparisons, such as sales this year vs. last year.
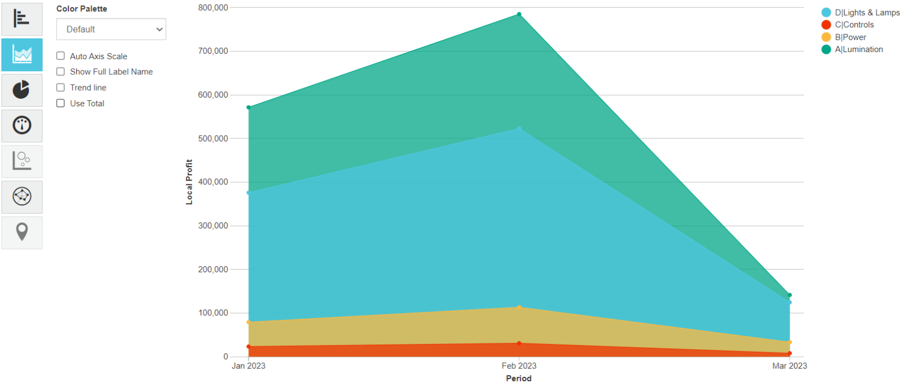
Plots performance over time, displaying data as a shaded ‘area’ that falls below a set of points connected by straight lines.
Useful for visualizing comparisons, such as product profit over time.
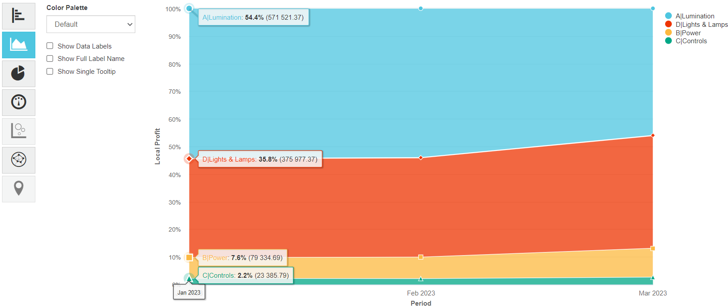
Same as the Area chart but the shaded areas are based on percentages rather than amounts.
Provides a different way to view proportional areas and has tooltips that display data details.
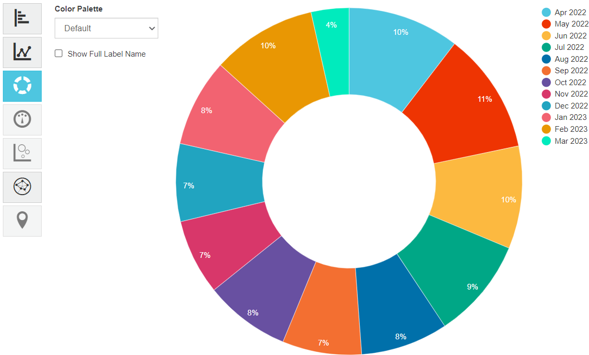
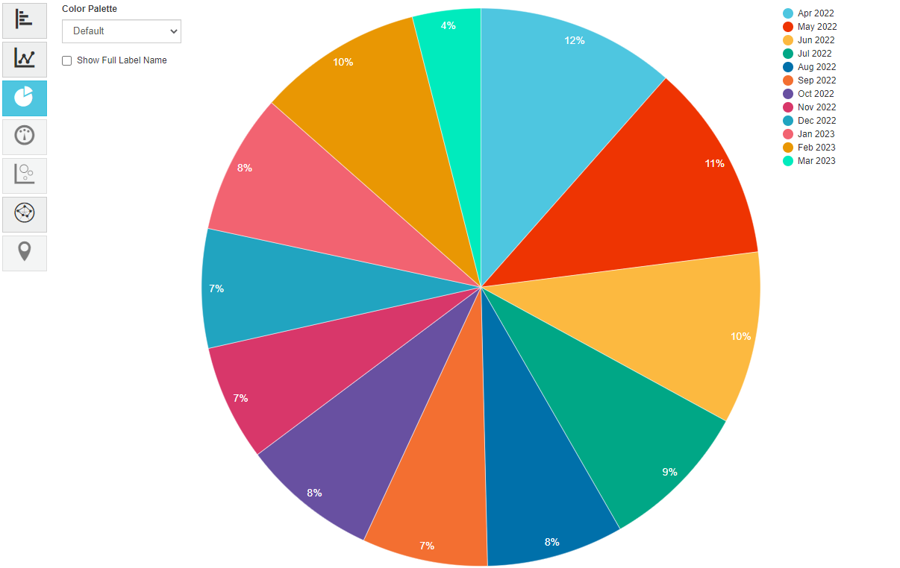
Displays the percentage share of a number of variables in a pie shape, where each segment is proportionate to the percentage value.
Useful for visualizing comparisons, such as revenue by region.
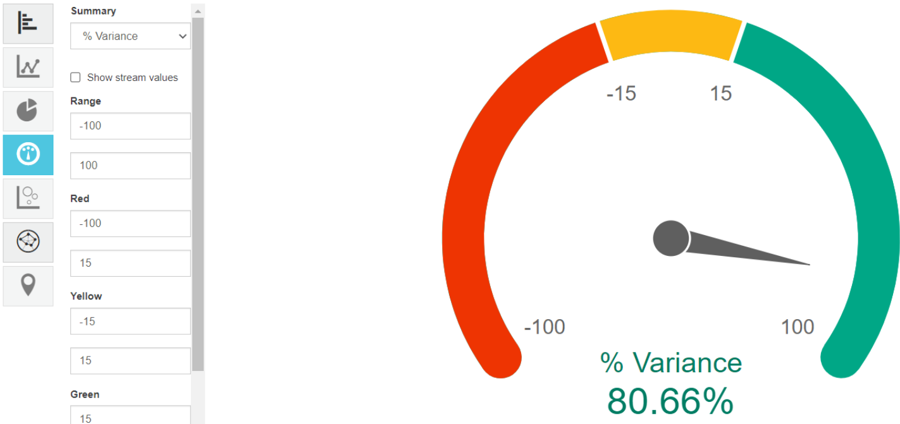
Displays performance against a range.
Useful for tracking performance against a target, such as Sales Rep performance, as illustrated in the dashboard image below.
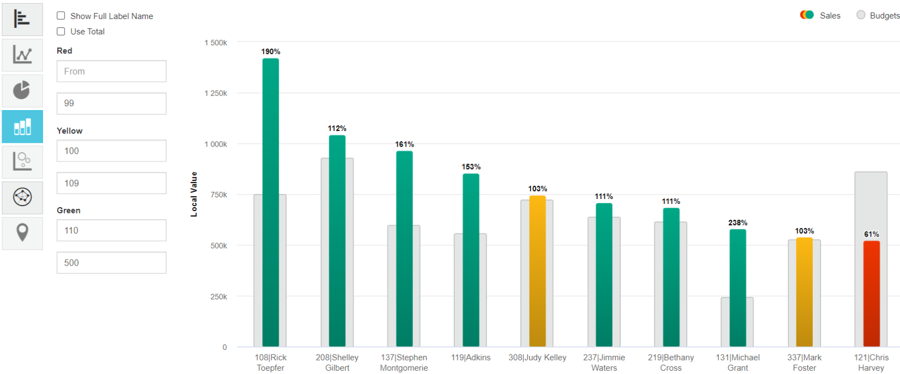
Displays results in a single column.
Looks similar to a Column chart but has more in common with a Gauge chart.
Useful for tracking performance against a target.
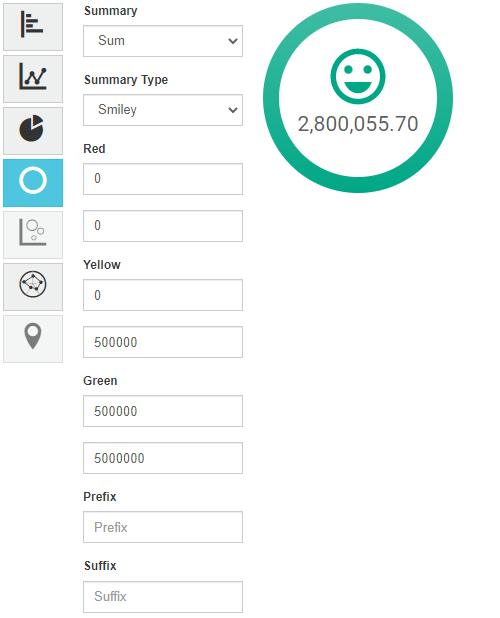
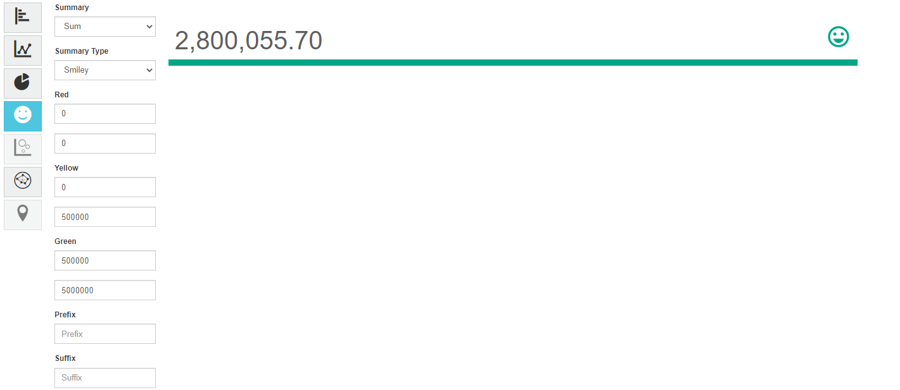
Displays just one number, either alone or with an icon, on a card.
Useful for displaying large numerical values, such as your total sales for the month.
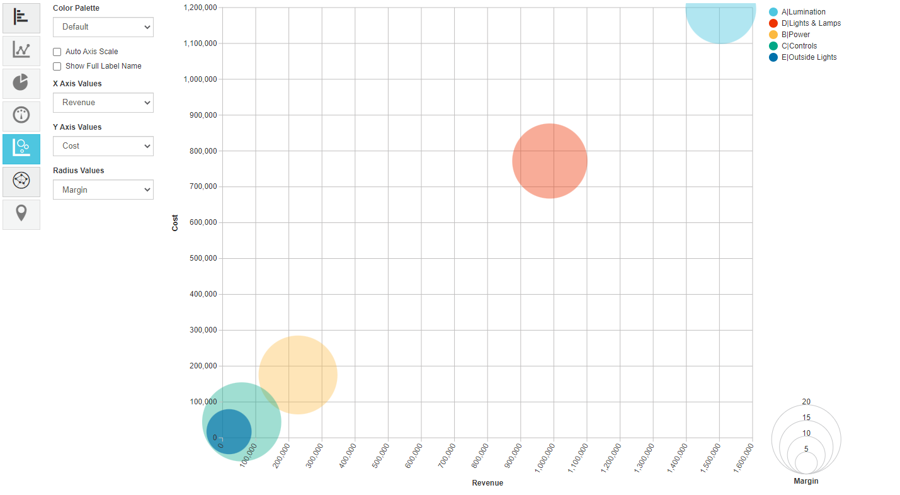
Displays color-coded circles (bubbles) plotted on an X and Y-axis to represent measures.
Useful for comparing measures, such as cost v revenue.
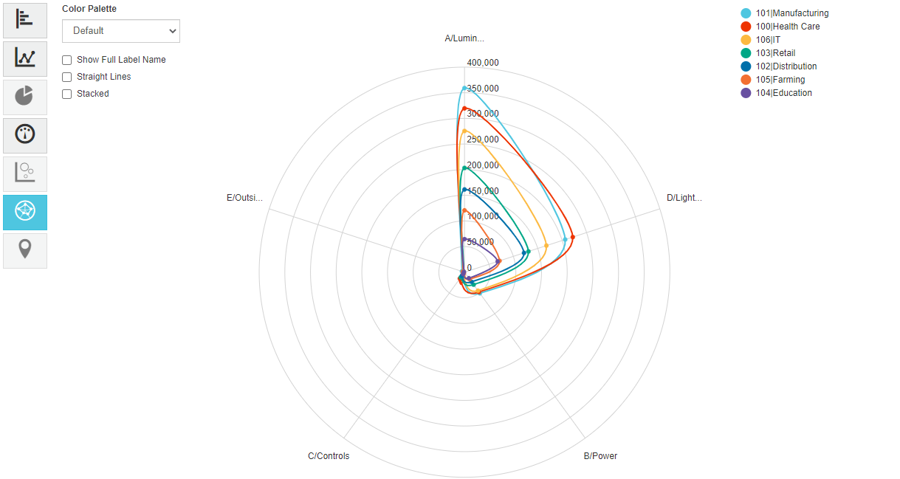
Plots variables by providing an axis for each variable, arranged radially (like bicycle spokes) around a central point.
Useful for charting matrix results, in other words, such as sales by product class and customer type.
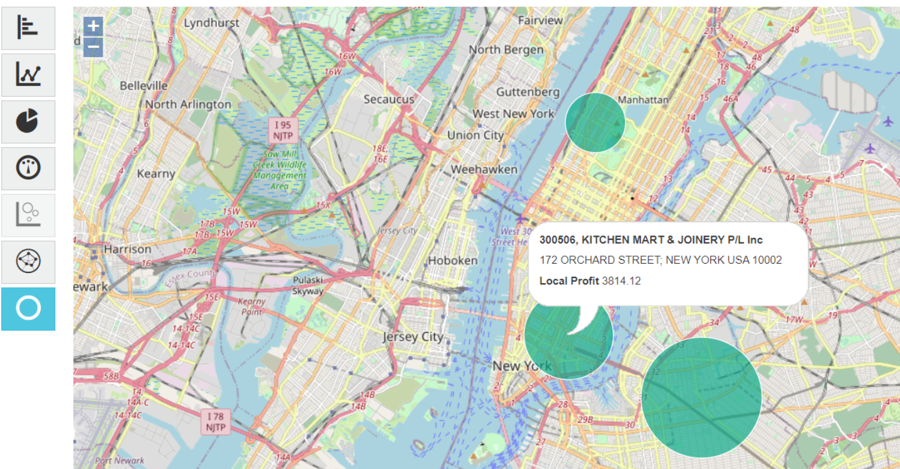
Displays a map with data points identified by a marker, circle or colored heat map.
Useful for locating data points of interest on a map.
