View a summary of the data
Get a high-level view of the data, the starting point for analysis.
As its name suggests, the Summary view displays a summarized view of your data. Depending on your analysis, this might be a summary of all the data in the underlying database or a summary of a selection of that data. What you can see and do depends on whether you have selected any dimensions.
In the Summary view, the Summary button (above the list of dimensions) is blue.
Watch this Phocas Academy video: Sort and summarize your data
View a summary of the database (no dimensions selected)
When you first open Analytics, you are in Summary view by default. As no dimensions are selected at this stage, the grid displays a summary of the whole database, which typically includes data for the current and previous periods and cumulative data.

In this summary context, some functions are unavailable or have limited options. You can change your view of the data in the grid to some extent. For example, you can select a different mode or period.
View a summary of selected data
When you select a dimension, you filter the data in the grid, so you are no longer in the Summary view. The Summary button is grey.
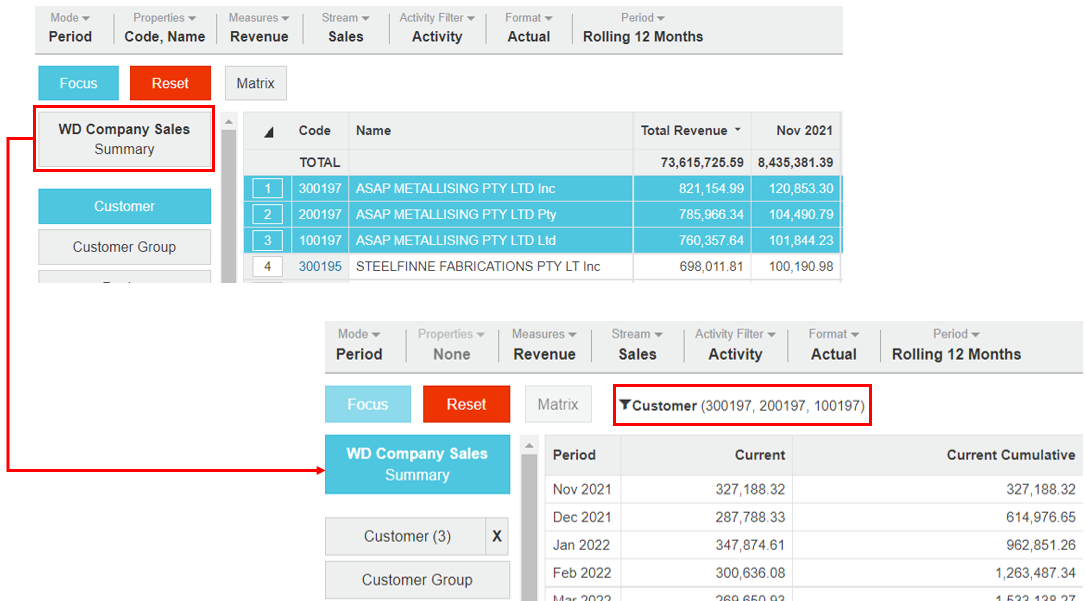
As you conduct your analysis, you might want to return to the Summary view to get a more concise view of your selected data. For example, suppose you focus on some rows within the Customer dimension but then want a high-level overview of those customers.
Click the grey Summary button. The grid displays a high-level overview of the selected rows (not the entire database). The header above the grid identifies the data that is being summarized.

The full range of functions is available in this context of the Summary view.
It's particularly useful to return to the Summary view when creating specific charts (such as a Line chart), as they display better with less detail.
Return to the database summary (no dimensions selected)
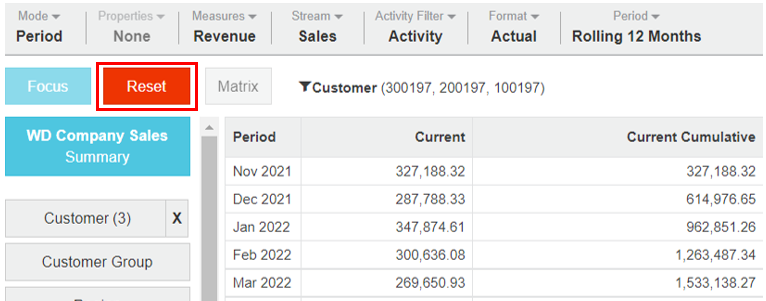
During your analysis, click the Reset button to return to the original summary view of the database.

