Use the chart legend
Change the position of the legend

View property details

Select and focus on data

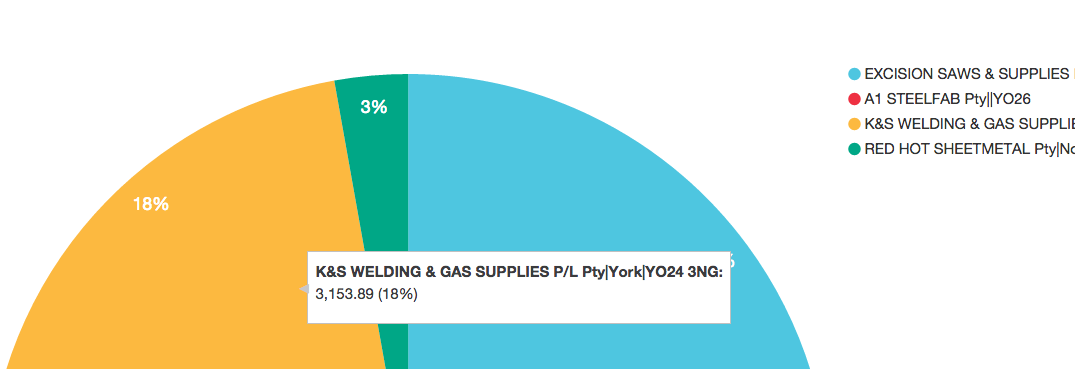
A legend displays to the right of most chart types. The legend's color coding matches the palette you select for your chart. The contents of the legend adjust according to the selected mode. If multiple measures are selected, they also display in the legend.
By default, the legend displays on the top right of each chart. You can use the Legend position setting to change where the legend displays or hide the legend from view.

In the legend below, a group of customers has been focused on and the following properties selected: Name, Suburb and Postcode (zip). These properties display in the legend.
This information also displays when you hover over a chart segment.

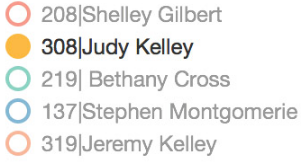
As well as being able to select and focus on a chart segment, such as a bar, column or wedge, you can select and focus on items in your legend. Selected items have a solid colored circle and black text (Judy in the example below). Unselected items have a hollow colored circle and gray text.

The order of items in the chart legend can be changed by sorting the respective columns in grid view.
