Radar chart
Availability:
Summary view - All modes except for Transaction mode.
Focused view (when you select and focus on items in a dimension) - All modes except for Search, Transaction and Market. It is particularly useful in Matrix mode.
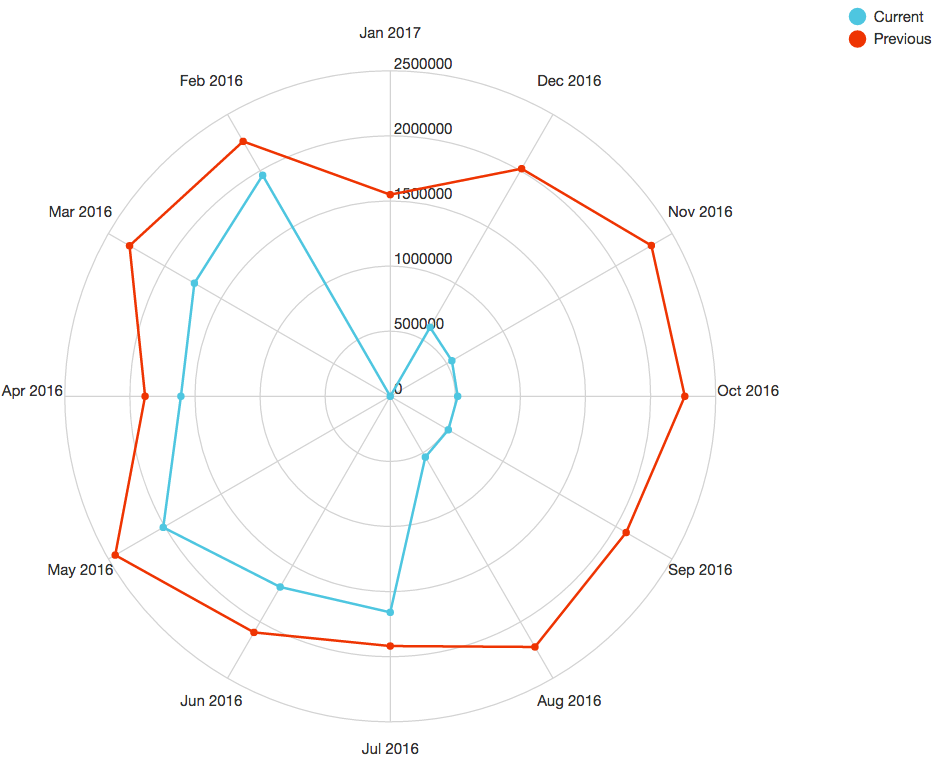
A Radar chart (sometimes known as a spider chart) plots variables by providing an axis for each variable, arranged radially (like bicycle spokes) around a central point.
A radar chart is particularly useful for charting matrix results, in other words, plotting two dimensions against each other. It is also useful for plotting monthly performance, where each 'spoke' is a month.
Typically, column headings in the grid are labels around the radar chart. Rows become the lines and legend of your radar chart. The first selected measure displays as labels on the vertical radius of your radar chart.
Summary view
Focused view
Contents
The lines depend on the mode:
In Period and Moving mode, there are lines for the current and previous periods.
In Stream mode, there are lines for the stream and variance stream.
In Total mode, there is one line for the total.
The circumference labels are each time unit (month/day/year) in the current period.
The contents depend on the mode:
In Period and Moving mode, there are lines for each of the focused items. The circumference labels are each time unit (month/day/year) in the current period.
In Variance mode, there are lines for the current and previous periods. The circumference labels are the focused items.
In Stream mode, there are lines for the stream and variance stream. The circumference labels are the focused items.
In Total mode, there is one line for the total. The circumference labels are the focused items.
Example
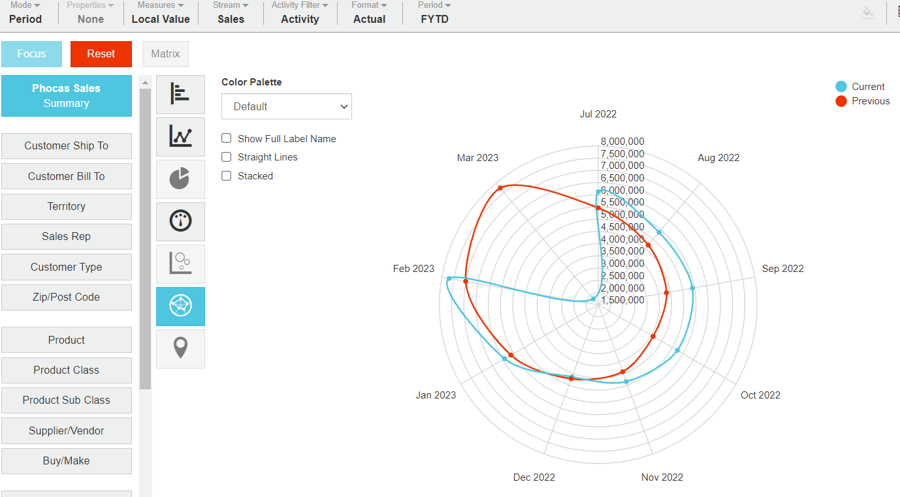
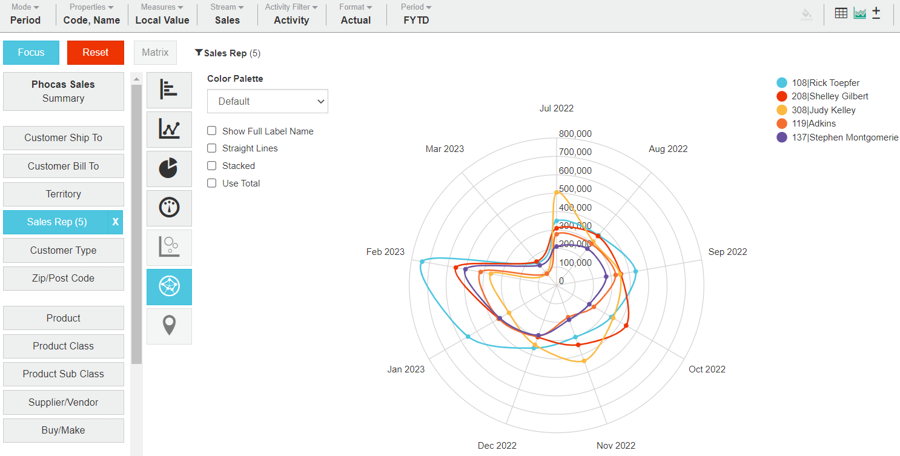
You have the option to display the lines between each point on the chart as straight, rather than curved (default).
Example: Compare Product Groups against Sales Reps
In the Sales database, create a Radar chart to display a matrix of Product Groups vs Sales Reps.
Prepare the data in the grid:
Select the Product Group dimension, then select the product groups (A, B, C and D) and click Matrix.
Select the Sales Rep dimension, then select and focus on the top five Sales Reps.
Click the Chart button in the top right toolbar above the grid.
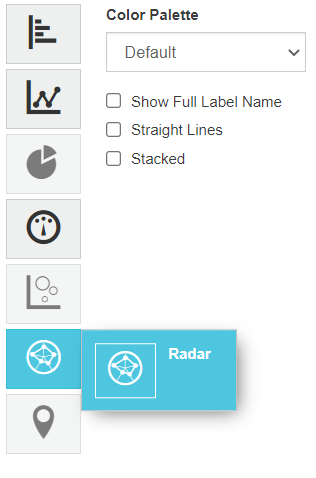
Click the Radar chart category button on the left of the chart and select the Radar option.
The radar chart displays, in which you can see that Fred and Alan perform strongly in Power but are weaker in both Outside Lights and Lights and Lamps. Harry sells lots of Outside Lights but performs poorly with Controls. Eugene and Harry have significantly weaker all-round sales results compared to the other reps.
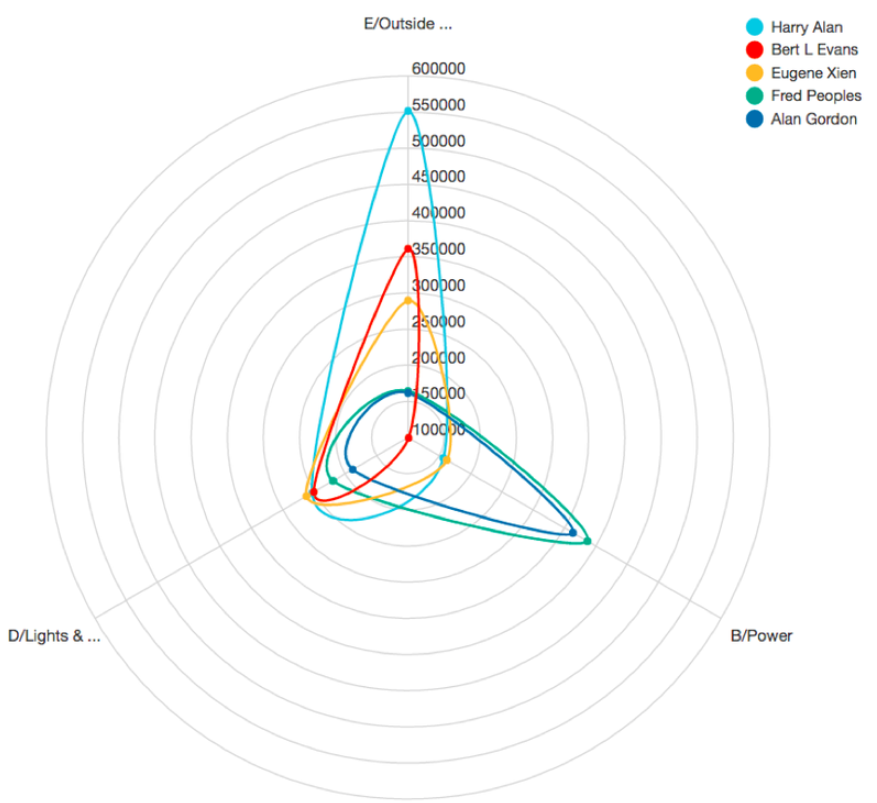
(Optional) Display straight lines: Select the Straight lines checkbox. The chart updates accordingly.
Related pages
You can take the following actions with your chart:
Configure the chart options | Select and focus on a chart segment | Use the chart legend | Save the chart as a favorite | Add the chart to a dashboard | Export a chart as an image
See also the main page: Visualize your data in a chart
Last updated
