Gauge chart
Available in a focused view (when you select and focus on items in a dimension), in all modes except for Transaction mode.
A Gauge chart is one of the KPI types of chart. It displays performance within a range. Red, yellow and green each represent a range entered you set up, typically relating to business goals or targets. The pointer typically moves from red or yellow to green when a target is met or exceeded. If left blank, no color will appear. These charts are useful for representing values within a simple range, for example, percentages, as they are typically in the range 0-100.
Gauge charts can be used for many reasons, such as:
To view data containing a comparison or variance, for example, sales vs. budget or profit this year vs. last year.
To count a number of something.
To track performance against a target, such as Sales Rep performance, as illustrated in the dashboard image below.

Example: Track Sales Rep performance against budget
In the Sales database, create a Gauge chart to visualize whether a Sales Rep is tracking against the budget.
Prepare the data in the grid:
Select the Sales Rep dimension, then select and focus on a particular rep (Bert).
Select Period > Year to date.
Select Mode > Stream, Stream > Sales and Variance Stream > Budget.
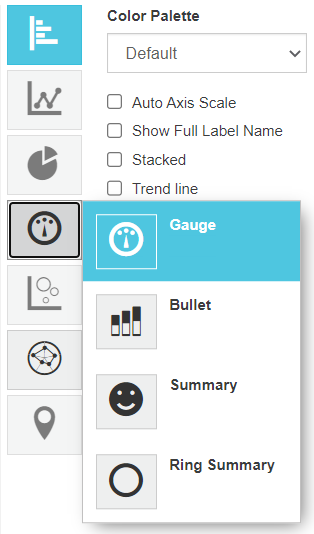
Click the Chart button in the top right toolbar above the grid, then click the Gauge chart category button on the left of the chart and select the Gauge option.

The default Gauge chart displays but it is meaningless as you have not yet configured the chart settings. Configure the chart:
Select Summary > % Variance.
Select the Show stream values checkbox.
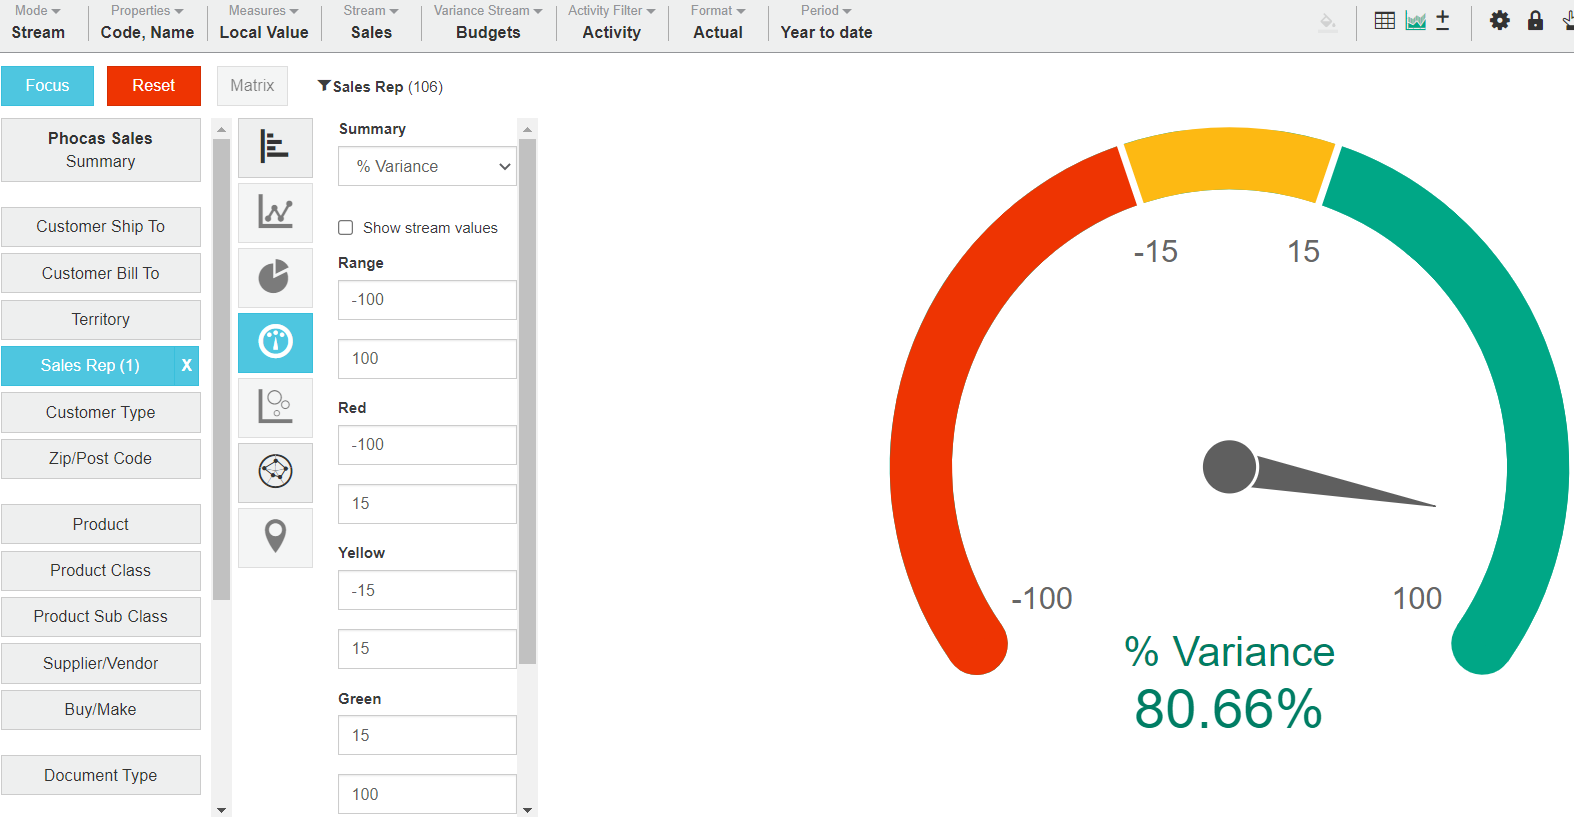
Enter the Range as -100 to 100, Red as -100 to 15, Yellow as -15 to 15 and Green as 15 to 100 (see image below).

The chart updates; it now compares Bert’s sales performance against budget. You can see that Bert is over 80% ahead of his budget.
Related pages
You can take the following actions with your chart:
Configure the chart options | Select and focus on a chart segment | Use the chart legend | Save the chart as a favorite | Add the chart to a dashboard | Export a chart as an image
See also the main page: Visualize your data in a chart
Last updated
