Pareto chart
Available in a focused view (when you select and focus on items in a dimension), in Total mode only.
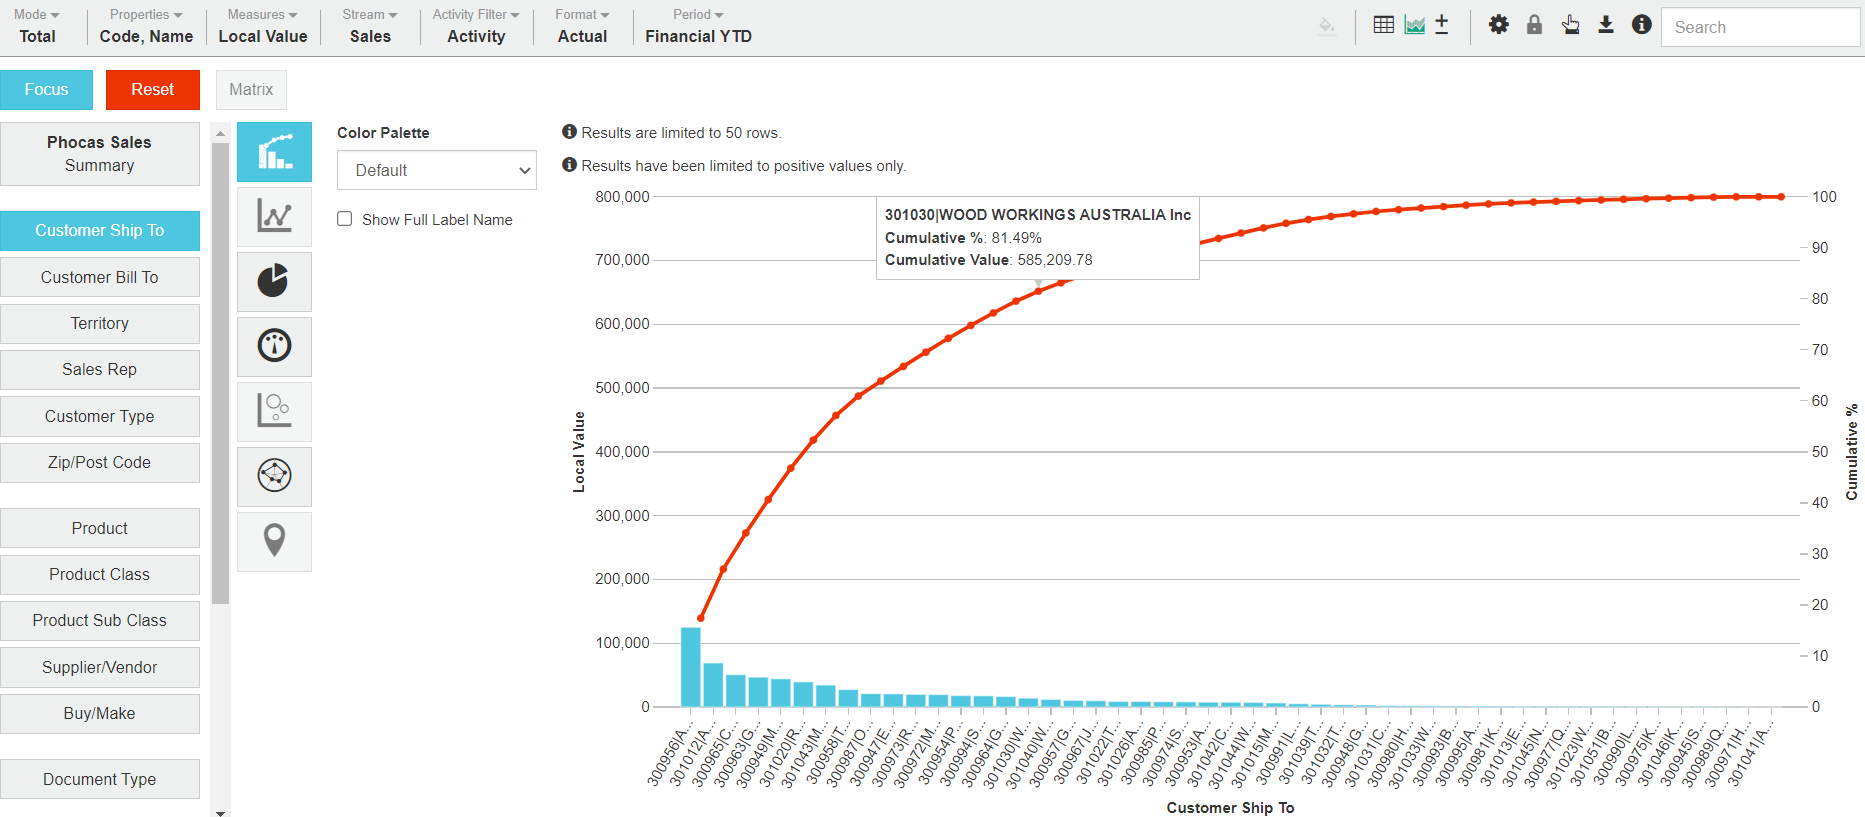
A Pareto chart shows the relative importance of differences between large sets of values. It shows cumulative totals of contributing factors to assess the success or failure metrics. It is often used for root cause analysis, in other words, to highlight the most significant cause of a certain outcome. It contains both columns and a line, with the columns representing individual values (in descending order) and the line representing the cumulative total.
Example 1: Use a Pareto chart to analyze sales revenue
In a Sales database, create a Pareto chart to see at a glance where the bulk of your revenue comes from.
Prepare the data in the grid: Select the Customer dimension, select Mode > Total, and select Period > Financial YTD.
Click the Chart button in the top right toolbar above the grid. The Bar chart type displays by default.
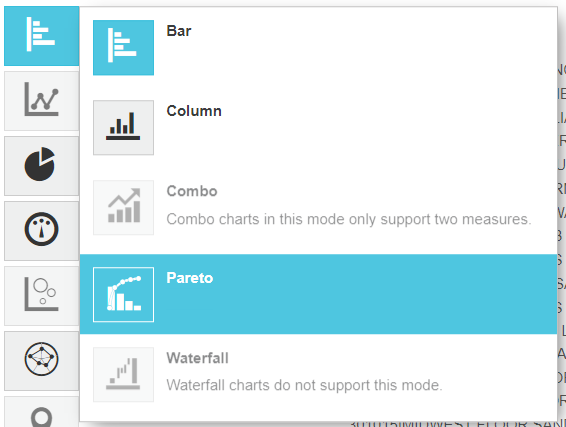
Click the Bar chart category button on the left of the chart and select the Pareto option.

The columns display revenue for individual customers, while the pareto line charts the cumulative total. You can hover over a data point on the pareto line to view the entity name, cumulative value and cumulative percent of overall revenue.

Example 2: Use a Pareto chart to identify the cause of a decline in sales
As a Sales Executive, you have been alerted to a decline in sales over a three-month period. You want to find the major contributors to the decline, initially at a customer level and then drilling further into region or product information.
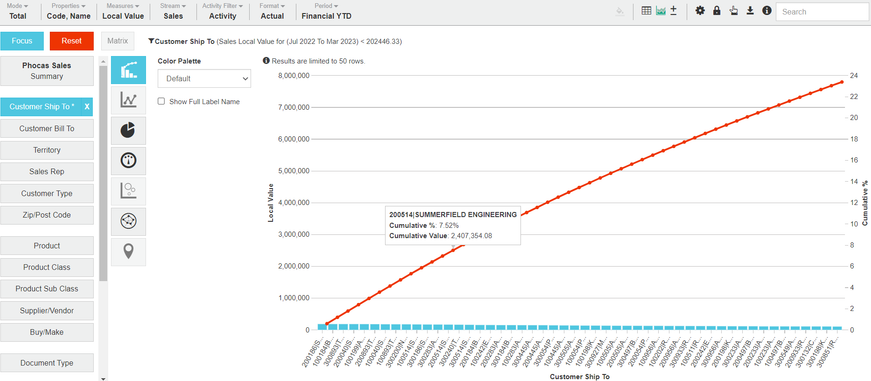
Prepare the data in the grid: Select the Customer dimension, then select and focus on the customers with sales of less than 200,000. Select Mode > Total, then select Period > Financial YTD.
Click the Chart button in the top right toolbar above the grid. The Bar chart type displays by default.
Click the Bar chart category button on the left of the chart and select the Pareto option. The columns display revenue for individual customers, while the pareto line charts the cumulative total. You can hover over a data point on the pareto line to view the entity name, cumulative value and cumulative percent of overall revenue. Now you have the customer overview, you can further slice and dice the data for a particular region, customer, product group or even product.

Related pages
You can take the following actions with your chart:
Configure the chart options | Select and focus on a chart segment | Use the chart legend | Save the chart as a favorite | Add the chart to a dashboard | Export a chart as an image
See also the main page: Visualize your data in a chart
Last updated
