Pie and Donut charts
Availability:
Summary view - Total mode only.
Focused view (when you select and focus on items in a dimension) - Period, Moving and Total mode only.
A Pie chart displays the percentage share of a number of variables in the shape of a pie. Useful for visualizing the results for different branches within a company or sales to different customers. You do not need to display your data as a percentage in the grid first, as Phocas automatically calculates the percentages when you create the Pie chart. The size of each segment is proportionate to the percentage value.
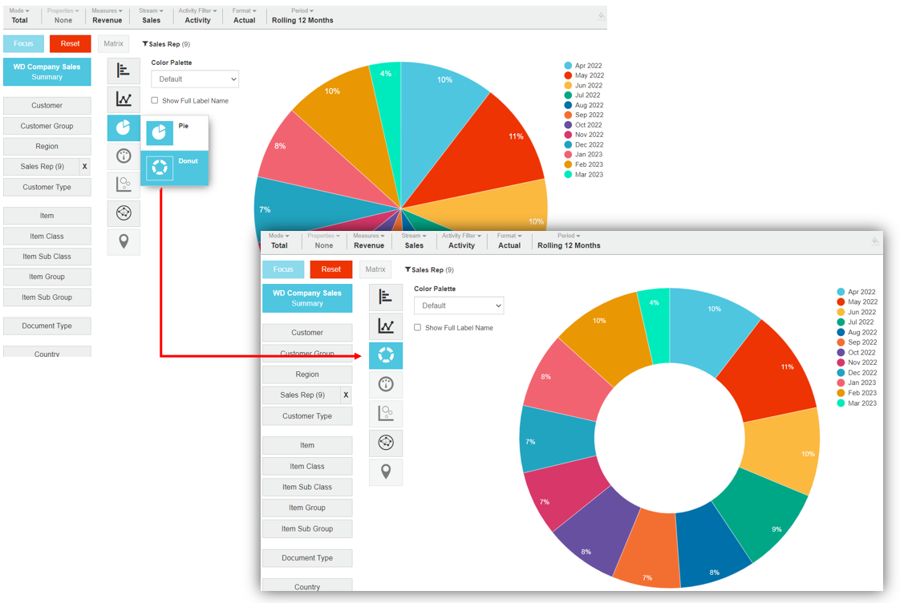
A Donut chart is very similar to a Pie chart, however, just as the name implies, it displays the data in the shape of a donut rather than a pie.
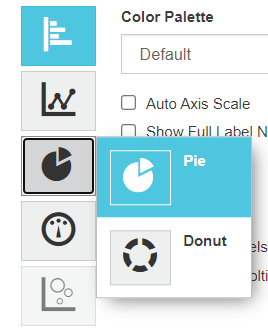
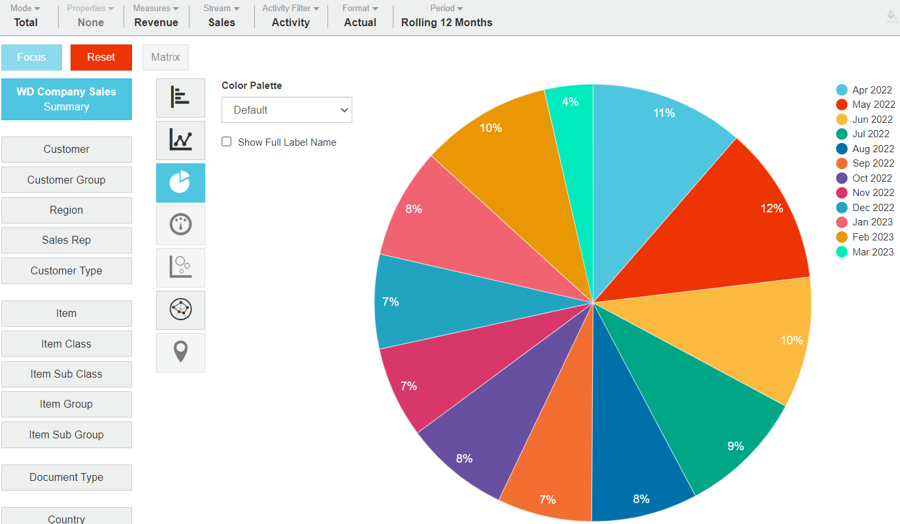
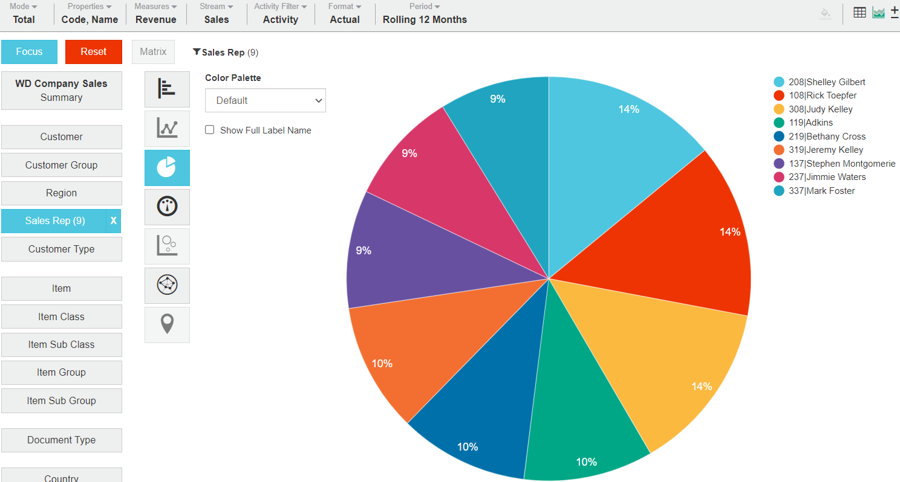
The following table describes what the Pie chart looks like in each view.
Summary view
Focused view
Contents
There are segments for each time unit (month/day/year) in the current period.
There are segments for each of the focused items.
Example
Example: Use a Pie chart to visualize the profit share of each country
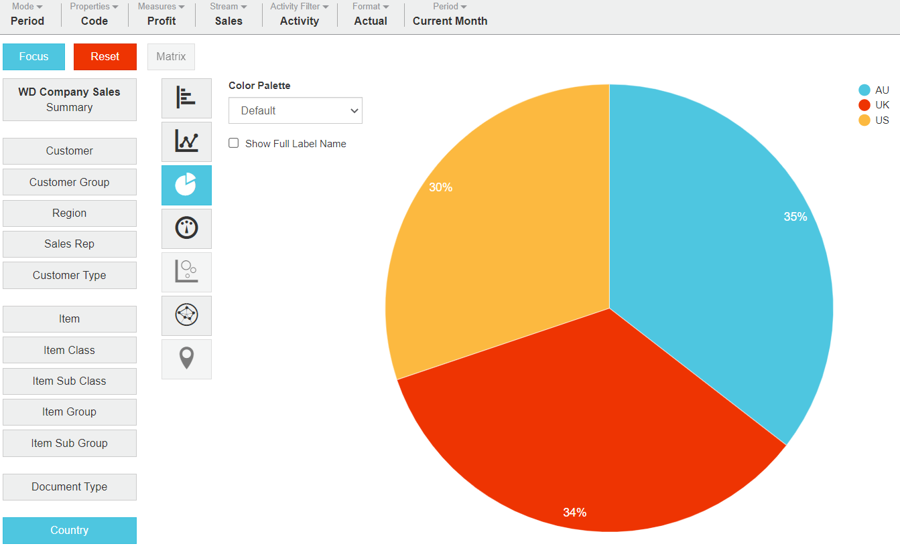
In the Sales database, create a Pie chart to visualize the profit share of each country this month.
Prepare the data in the grid:
In Period mode, select the Country dimension.
Select Measures > Profit.
Select Period > Current Month.
Click the Chart button in the top right toolbar above the grid, then click the Pie chart category button on the left of the chart and select the Pie option.
The chart displays the profit share of each country this month.
Example 2: Create a Donut chart
Prepare the data in the grid.
Click the Chart button in the top right toolbar above the grid.
Click the Pie chart category button and select the Donut option.
Related pages
You can take the following actions with your chart:
Configure the chart options | Select and focus on a chart segment | Use the chart legend | Save the chart as a favorite | Add the chart to a dashboard | Export a chart as an image
See also the main page: Visualize your data in a chart
Last updated
