Bullet chart
Availability:
Summary view - Period and Stream mode only.
Focused view (when you select and focus on items in a dimension) - In Variance and Stream mode only.
Watch this Phocas Academy video: Bullet charts
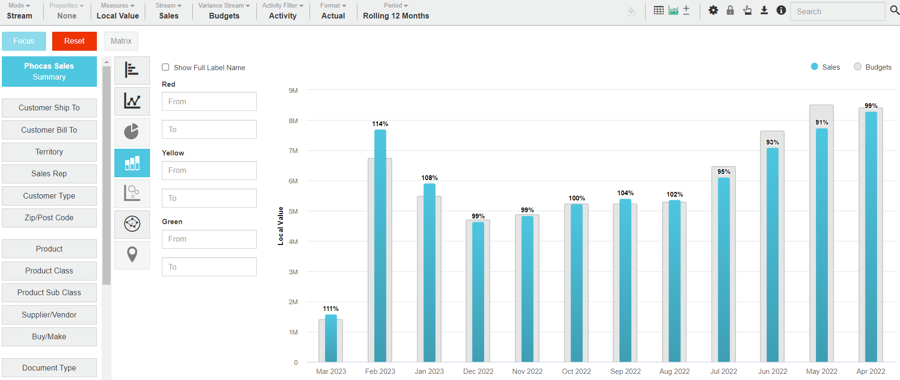
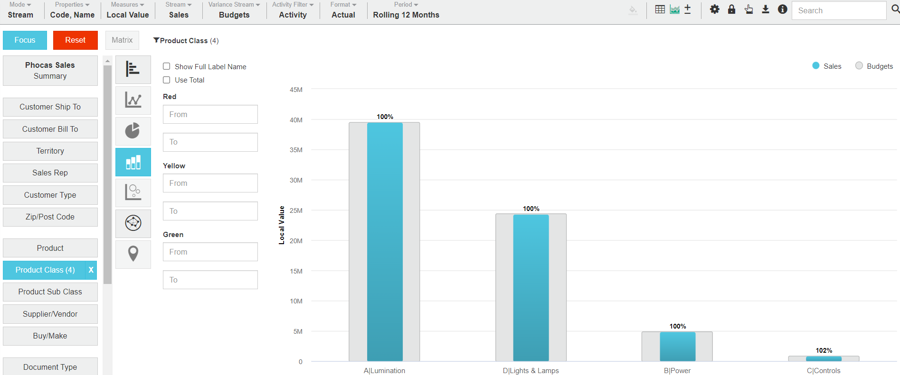
A Bullet chart is one of the KPI types of chart. It displays results in a single column. It looks similar to a Column chart, as it uses columns, however, it has more in common with a Gauge chart, as it is another way to visually track performance against a target.
Each ‘column’ is in fact made up of two columns. The gray column typically represents a target and the colored column represents the actual performance, a little like a fuel gauge or thermometer. By default the ‘colored’ column is blue but you can apply conditional formatting to change the colors to red, blue and/or green.
The bullet chart will always display the target %, even when this is not displayed in the grid.
You can hover over a column to display a tooltip with the values and target %.
Summary view
Focused view
Contents
There are columns for each time unit (month/day/year) in the period (or stream).
There is a column for each of the focused items.
X-axis
The X-axis displays the time units of your current period.
The X-axis displays each focused item.
Y-axis
The Y-axis displays the total, which starts at zero.
The Y-axis displays the total, which starts at zero.
Example
Example: Track Sales Rep performance against budget
In the Sales database, create a Bullet chart to visualize the Sales Rep performance against the budget.
Prepare the data in the grid:
Select the Sales Rep dimension, then select and focus on the top ten performing Sales Reps.
Select Period > Year to date.
Select Mode > Stream, Stream > Sales and Variance Stream > Budget.
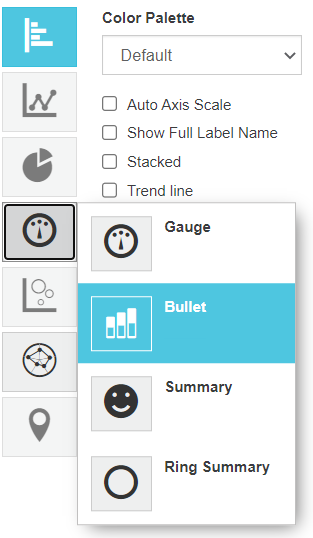
Click the Chart button in the top right toolbar above the grid, then click the KPI chart category button on the left of the chart,KPI chart category button on the left of the chart and select the Bullet option.
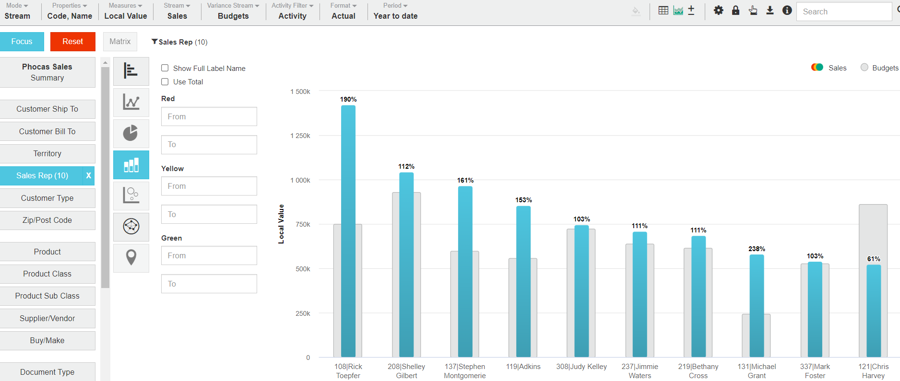
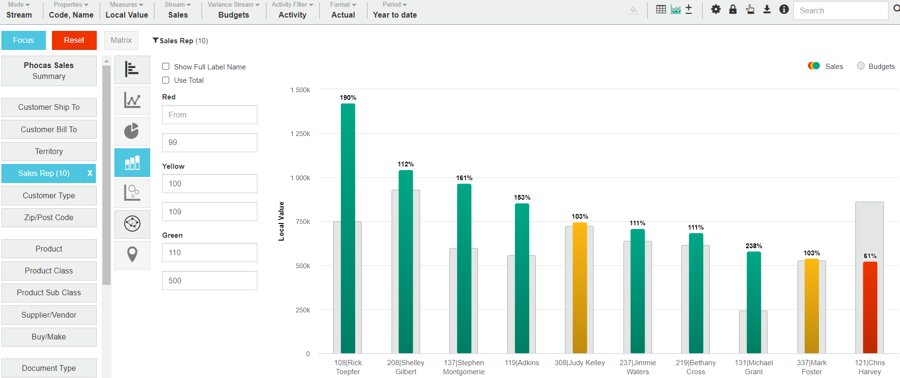
The default Bullet chart displays with the grey and blue columns. The grey column represents the budget and the blue columns represent sales. The percentage shown is target %.
(Optional) Associate traffic-light colors with the sale performance: Enter the From and To value range into the color boxes to set the conditional formatting. In this example, if the Sales Reps achieve more than 110 of budget, the column is green, if they achieve budget, it’s yellow and if they do not achieve budget (<99%), it is red.
Related pages
You can take the following actions with your chart:
Configure the chart options | Select and focus on a chart segment | Use the chart legend | Save the chart as a favorite | Add the chart to a dashboard | Export a chart as an image
See also the main page: Visualize your data in a chart
Last updated
