Change the mode
User permission: Query > Mode
Depending on your user profile, you might not have access to certain modes, and some modes are not always available on all Phocas sites.
A mode is a pre-defined view of data that displays particular columns in the grid. Changing the mode allows you to quickly change the columns and therefore, the data that displays in the grid.
Some modes are only available when you select a dimension and are in a filtered view, and some modes work differently when you are using the Summary view.
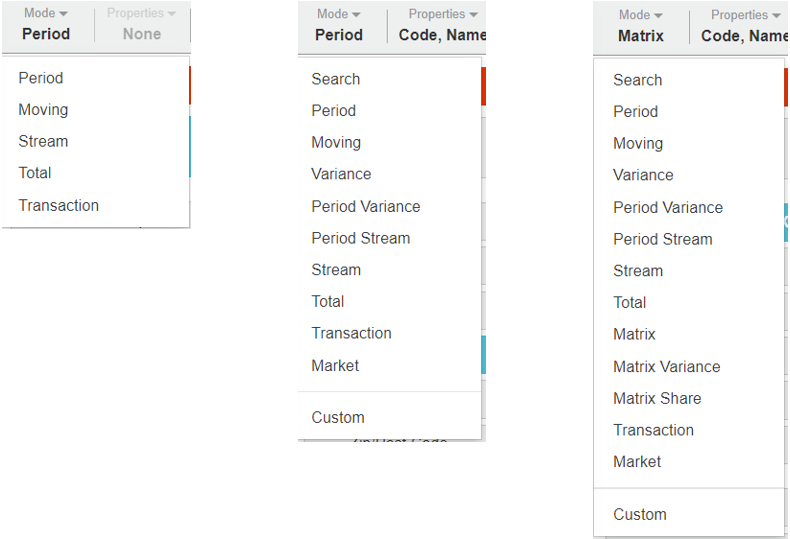
Click the Mode menu and select the mode you want to apply to the grid. The grid updates automatically to display the new column layout and the Mode menu displays the name of the selected mode.

The following list gives a brief description of each type of mode. Click the links for more information and examples.
Period (default): In the Summary view, provides a high-level overview of all your data. With a dimension selected, provides a month-by-month or day-by-day view (current period) of your data.
Period Variance: Combination of Period mode and Variance mode; compares time units within current and previous periods side-by-side, for example, months of this year vs. months of last year.
Period Stream: Combination of Period mode and Stream mode; compares two streams of data side-by-side, such as your sales vs. budget, for selected date ranges.
Moving: Similar to Period mode, except that each month has the previous 11 months added to it, thus creating a moving, annual total view.
Stream: Compares two or more streams of data side-by-side, such as this current vs. budget.
Total: Simplest view available - removes other columns (with the exception of the properties) and shows only a Total column.
Transaction: Most detailed view available - takes the data currently displayed in the grid and replaces it with the relevant individual transactions.
Search: Displays your complete 'master' lists, such as customer master or product master, independent of periods and without any transactions listed. Good for fast searching. Only available when a dimension has been selected.
Variance: Compares current and previous period data side-by-side, such as this year vs. last year. Only available when a dimension has been selected.
Market: Compares a market segment to the overall market. Only available when a dimension has been selected.
Matrix: Plots two dimensions against each other (one as columns, the other as rows), similar to a pivot table. Good for identifying cross-sell opportunities and gaps. Only available when a dimension has been selected. Initially accessed via the Matrix button rather than the Mode menu.
Matrix Variance: Takes your existing matrix and adds a variance, so you can make comparisons, such as this year vs. last year. Only available in the Modes menu when you are in Matrix mode.
Matrix Share: Takes your existing matrix but displays the data as a percentage. Each row sums to 100%. Only available in the Modes menu when you are in Matrix mode.
Custom: Allows you to edit and rearrange columns in the grid, create new columns, and use calculations. Only available when a dimension has been selected.
