Change the properties
User permission: Query > Properties
You must select a dimension to activate the Properties menu; it is not available in Summary view.
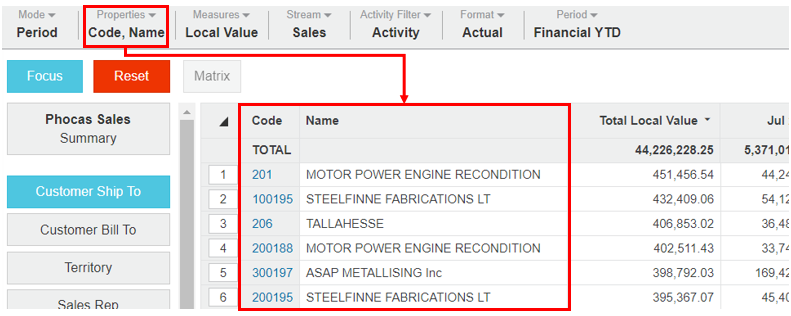
Properties are information stored about a dimension, displayed as columns in the grid when you select that dimension. By default, the Code and Name property columns display for all dimensions.

The available properties depend on the selected dimension and the underlying database. For example, you might have the Address property for a Customer dimension or Unit of Measure property for the Product dimension.
You can remove one or both default properties and add other properties as required. The grid updates to display the selected properties, which remain until you reset the grid, at which point the default properties display once again.
The Properties menu label identifies the selected properties. If multiple properties are selected, a summary displays. You can hover over the Properties menu to display a tooltip listing all the selected properties.
Add and remove property columns
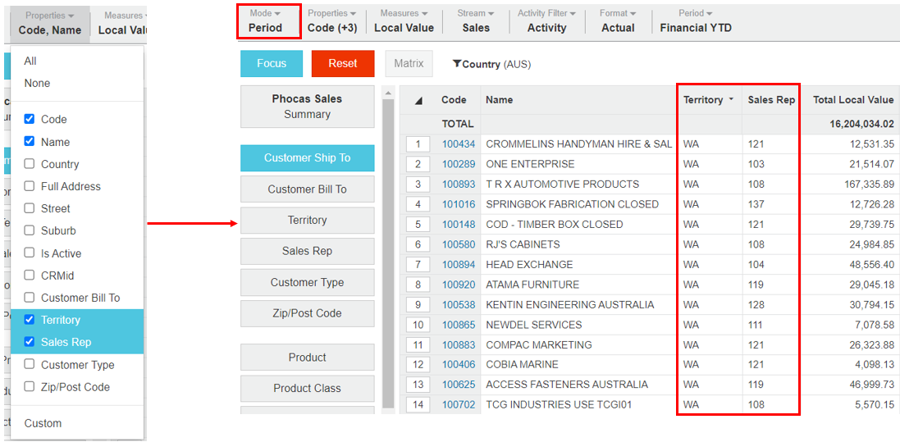
Click the dimension, then click the Properties menu.
Select the checkboxes of the properties you want to add to the grid and clear the checkboxes of the properties you don’t want.
To quickly select and apply one property only, double click that property in the list.
If you’ve added levels to the grid (you're viewing a nested grid), you can't turn off the Code property because it’s required to link the nested rows together correctly.
Click anywhere outside the Properties menu to update the grid and view the new properties.
Example 2: Use properties to help pinpoint information
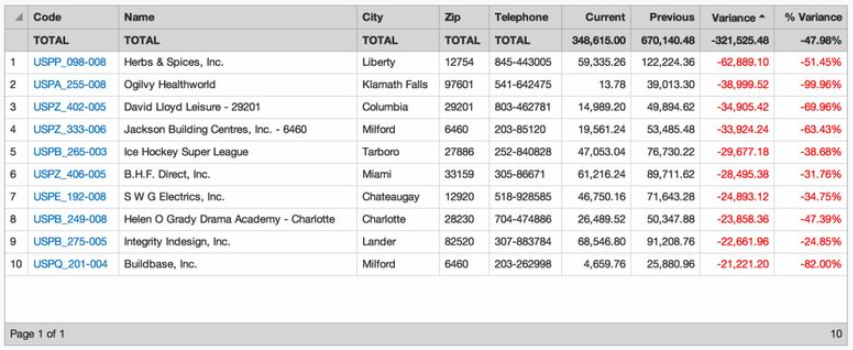
Suppose you want to identify the 10 customers who are declining the most in the year to date, and get some useful details (properties), such as their contact details.
Click the Customer dimension, then click Mode > Variance.
Sort the Variance column in ascending order. The worst performing (declining) customers display at the top of the list.
Select and focus on the 10 worst performing customers (top 10 in the list).
Add the City, Zip and Telephone properties (see above). The new property columns display in the grid, so you can now see the contact details of those declining customers.

When the grid has a lot of columns and you need to scroll horizontally to view the far-right columns, it is useful to freeze the property columns so they always remain in view.
Example 3: Use properties to create a new dimension
A property can be used as if it is a dimension, to display a subset of data that was not previously available via the dimensions list on the left of the grid.
For example, suppose you want to analyze the Sales data according to the suburbs in which your customers are located but you do not have a Suburb dimension.
Click the Territory dimension, then select and focus on the territory you are interested in (California in the USA).
Click the Customer dimension.
Add the Suburb property and remove all other properties. All the customers are now grouped into their respective suburbs. You can now continue with your analysis from this point forward.
Watch the video at the top of the page: Narrow your search by entity or property
Create a custom property
You can create a custom property based on properties and measures that are stored against dimensions in the database. Custom properties are useful, as they can be saved and applied to analyses that you conduct frequently. Once saved, the custom property displays in the Properties menu for the relevant dimension. When you select and apply a custom property, the grid automatically changes to Custom mode.
Click the dimension and click the Properties > Custom. The process you follow in the Custom Properties window is similar to the process of adding columns in Custom mode, or performing an advanced search. If you have permission, you will also see an option to share the custom property with other users.
For example, suppose you have a ‘2021 price’ property and a ‘2022 price’ property for your Product dimension* but you want to get an average price across the two years. You can achieve this by creating a custom property (Avg Price) based on a calculation.

The new property will display in the Properties menu for the Product dimension and when selected, a new column for the Average Price displays in the grid.
These two properties need to be numeric properties, as set in Designer, in order to display in Analytics.
View all properties
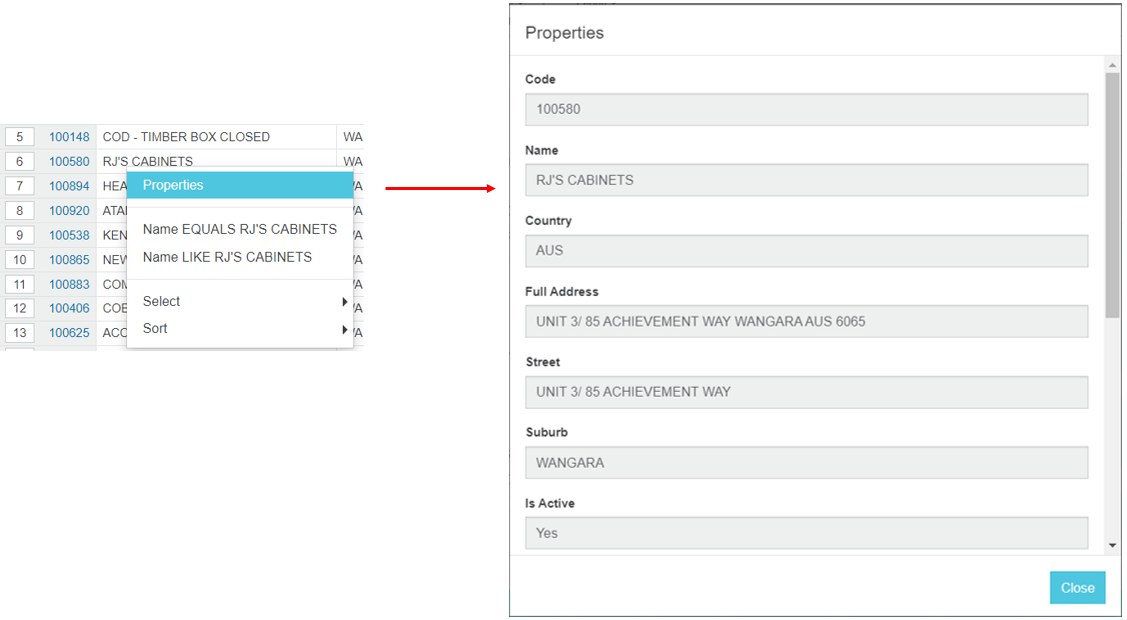
Right-click > Properties on any row (or long-tap on a device) to display a window containing all properties for that row, including those not displayed in the grid.

Last updated

