Market mode
Impact on performance: Market mode can have a major impact on performance, especially on large databases. While it can be used effectively on general queries, caution should be used when using this option on a collection of dashboard widgets, as the compound impact on performance can be severe.
You must select a dimension to activate this mode; it is not available in Summary view. This mode cannot be charted.
Market mode counts the number of entities (such as customers) in one column (the market*) and a subset of entities in another column (the segment), then compares the results in a third column. You can use Market mode to compare a market segment to the overall market, in other words, to calculate and display the market penetration.
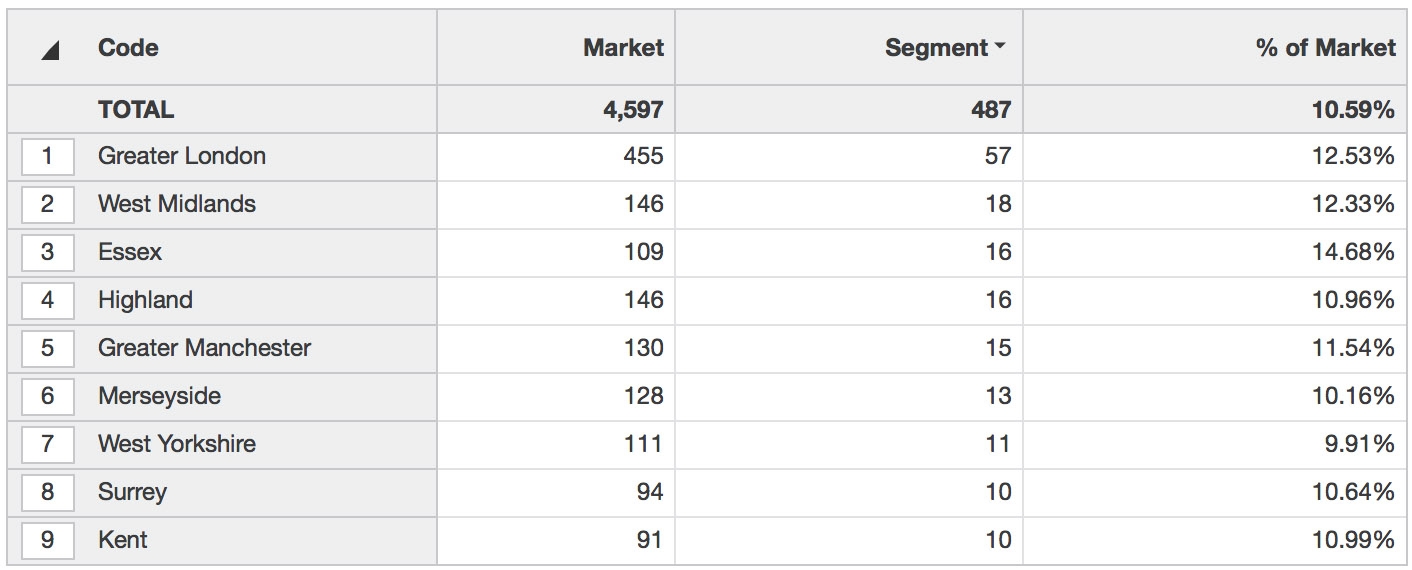
Looking at the first line in the image below, the total market in Greater London is 455 customers but only 57 of those customers are buying this segment (the selected product groups), giving a market penetration of 12.53%. This example uses a count measure but other measures, such as value or quantity, can also be used.
* The market only includes selections that have activity in the period.
The following example shows the number of customers (market) who bought downlights and transformers products (segment).
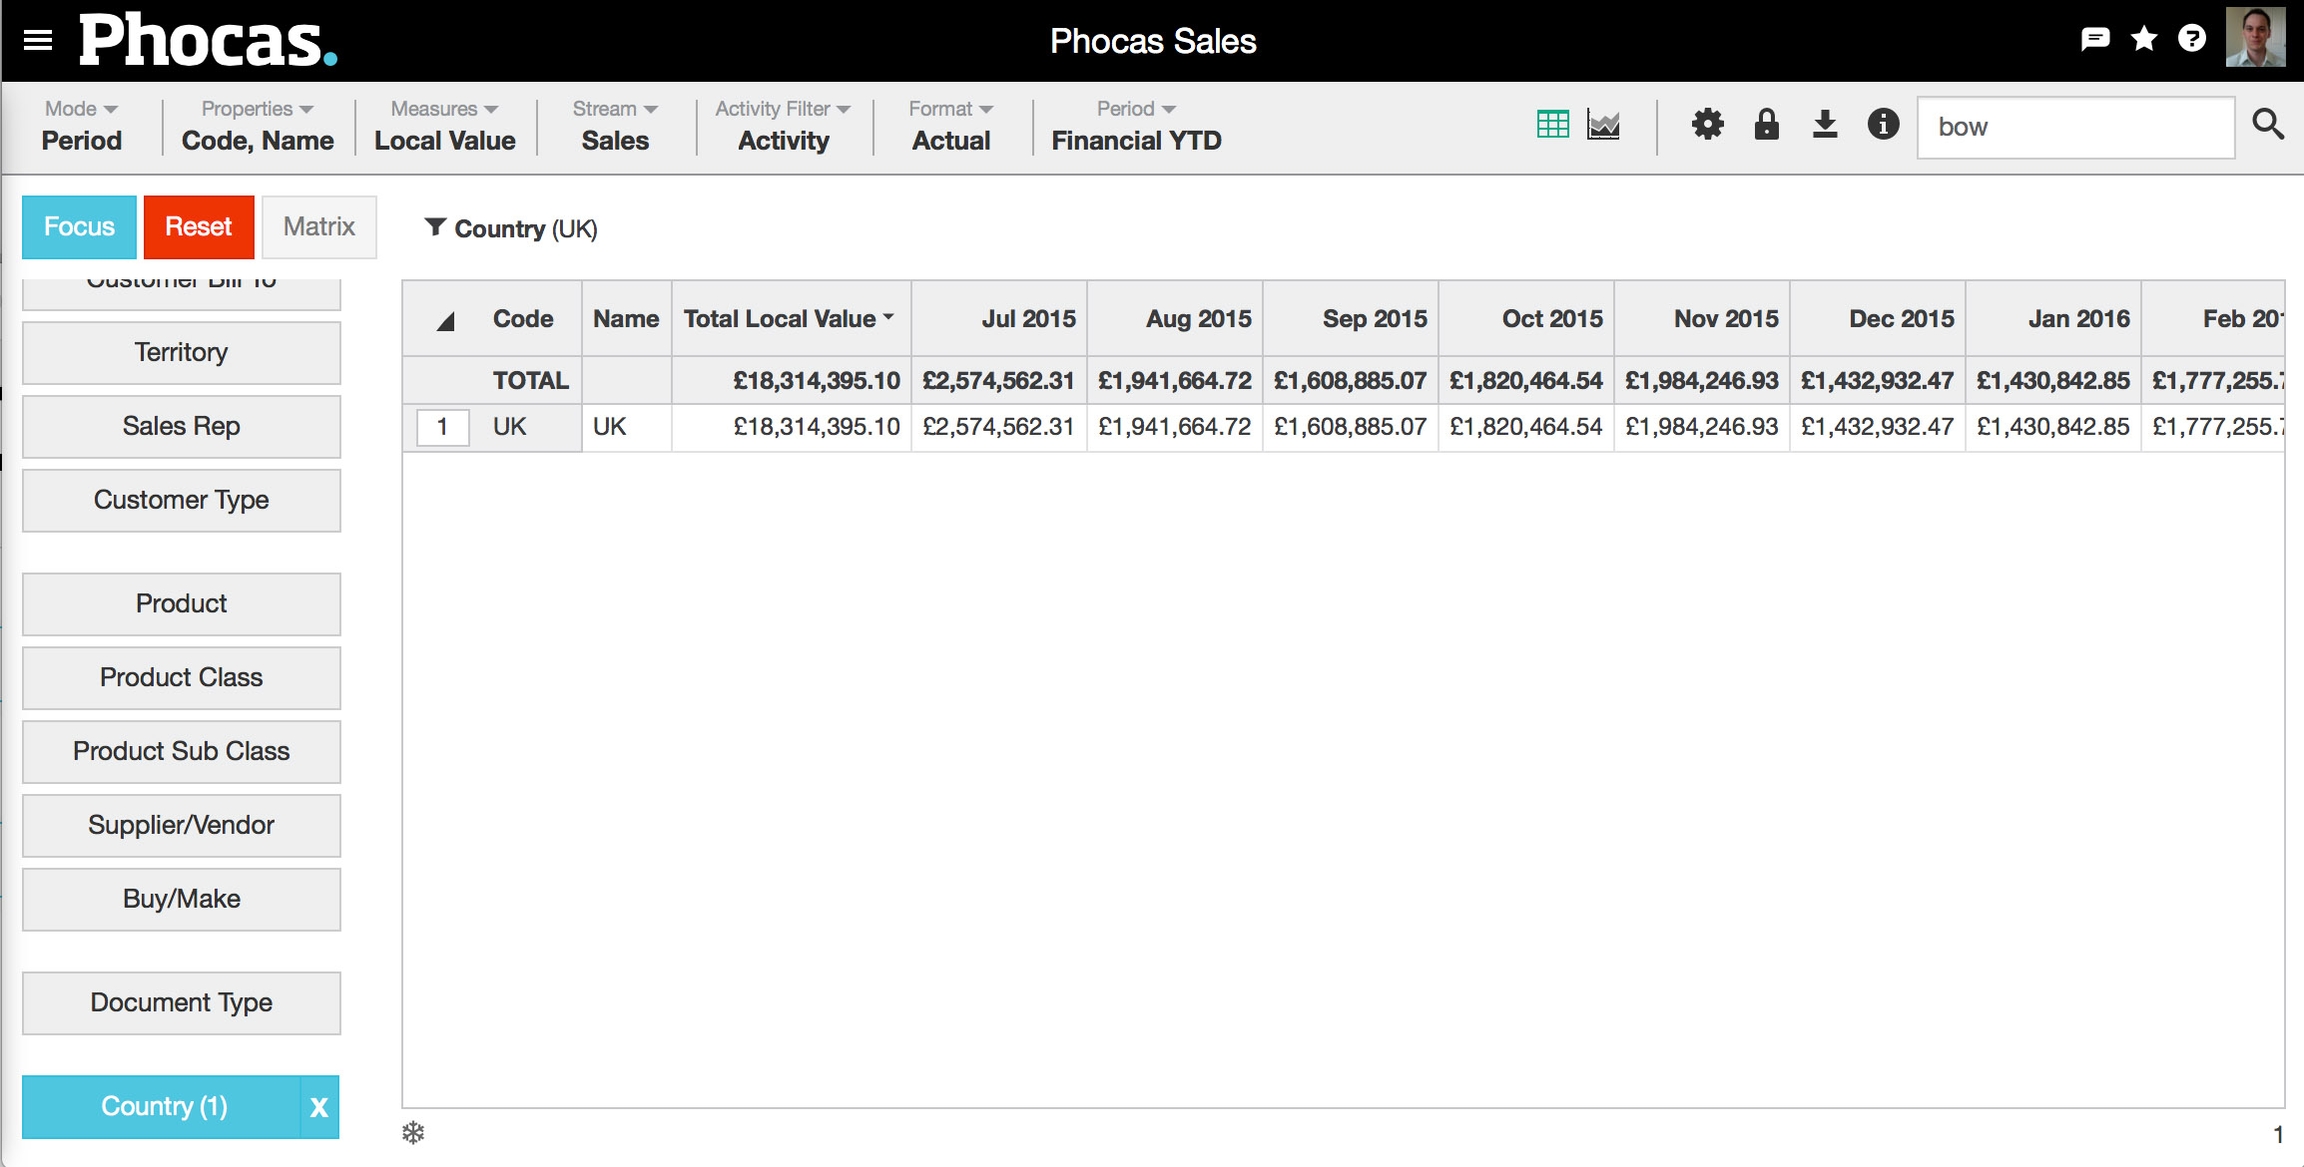
Select the market: Click the Country dimension, select the UK country, then click the Focus button. The grid displays columns for the active properties (such as Code and Name) for that dimension, a Total column, and a column for each time unit in the current period.
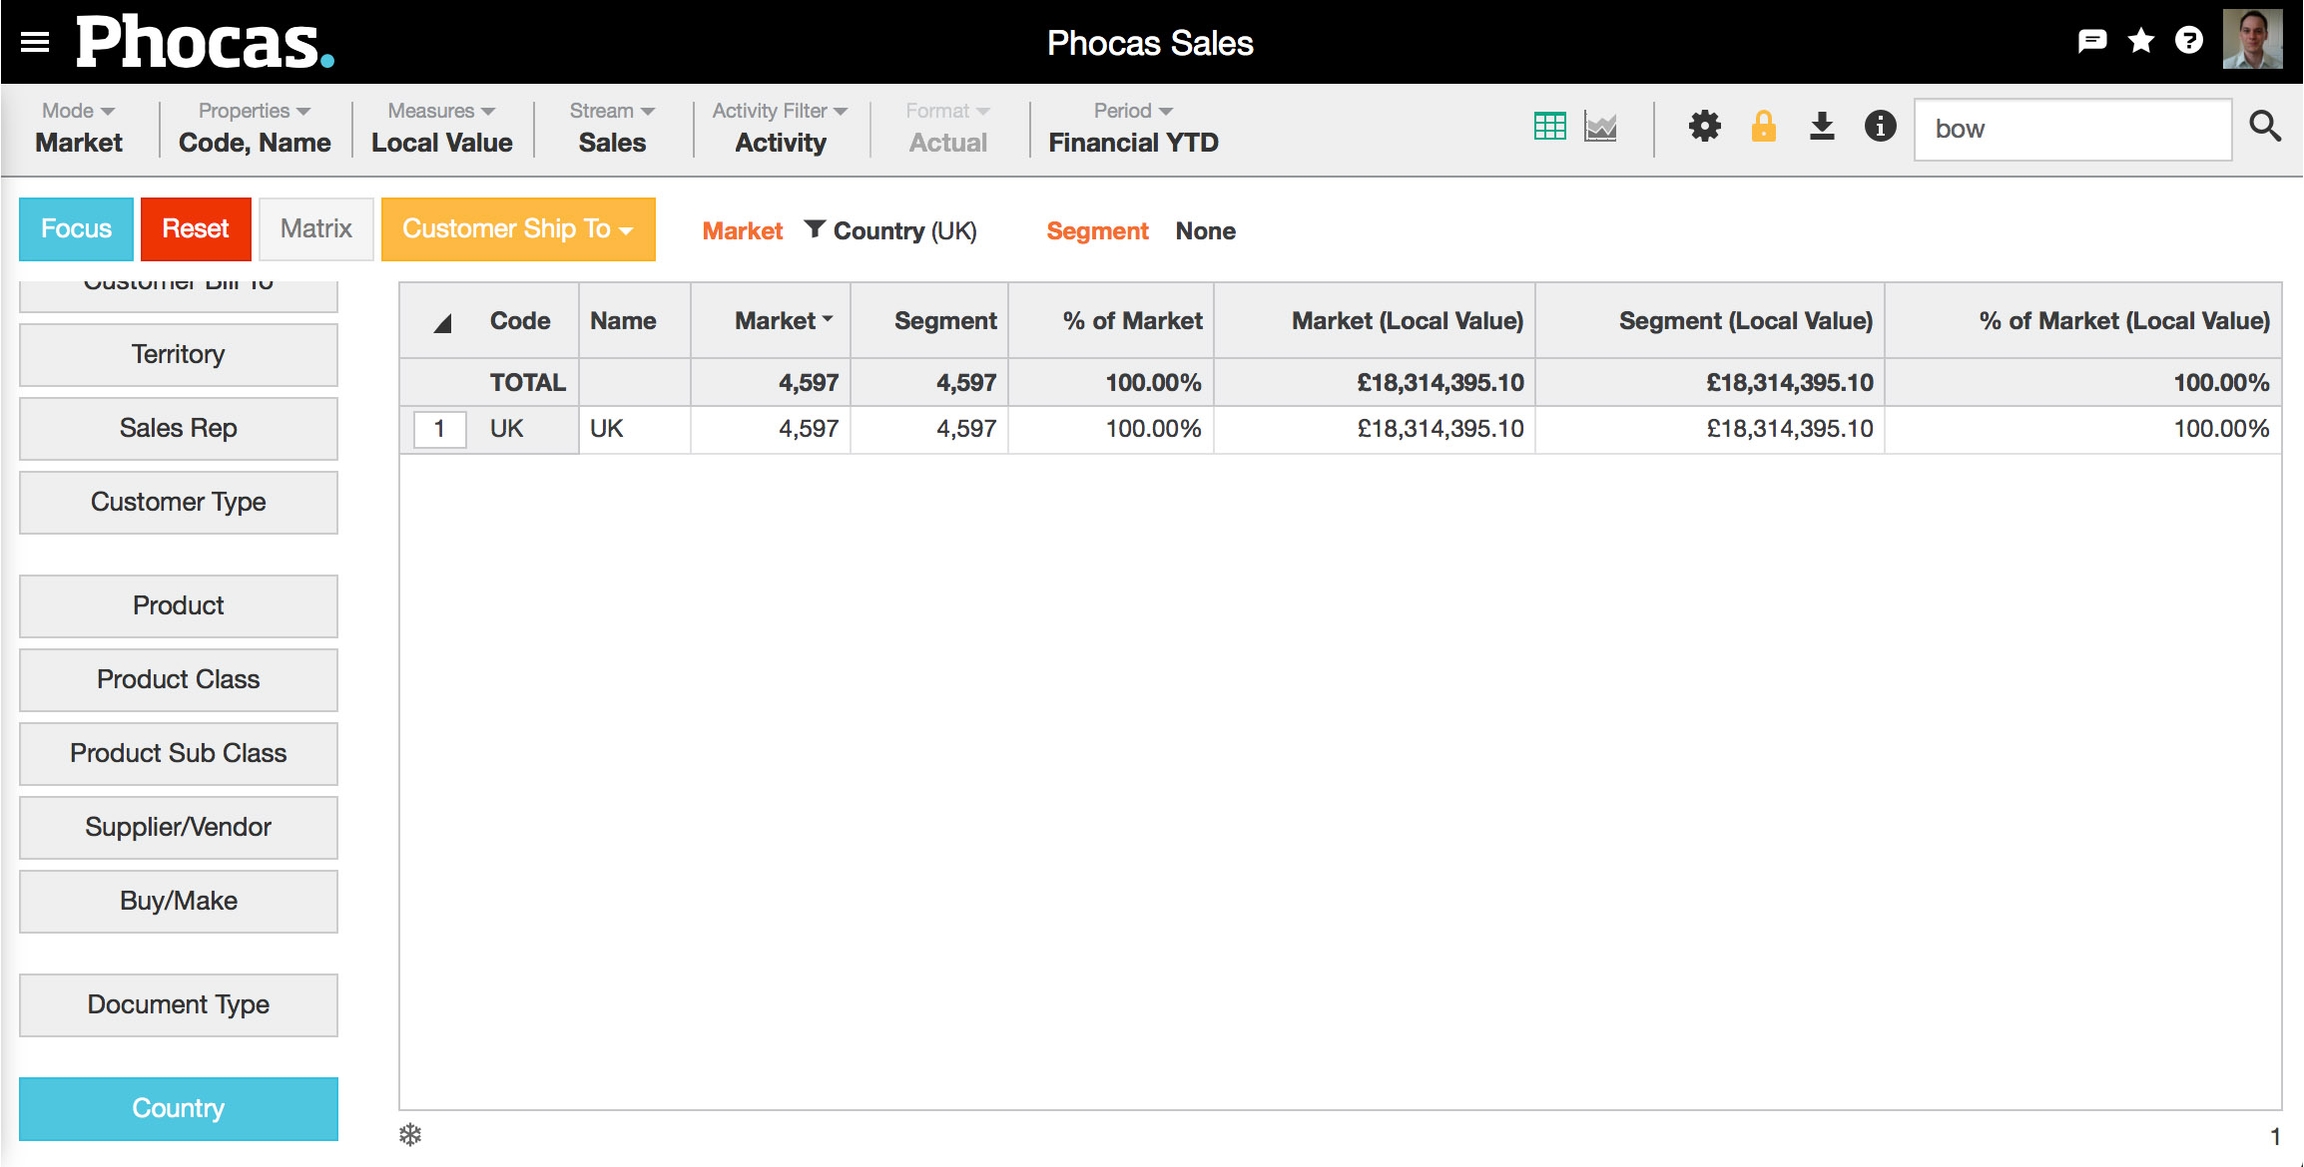
Select the mode: Click Mode > Market. The selections you made above display next to the word Market in the status bar. They function in a similar way to the lock selections functionality (they no longer display on the dimension button). The grid updates to display the following new columns for each measure: Market, Segment and % of Market.
Select the segment: Click the Product Sub Class dimension, select the Downlights (DL) and Transformers (TR) products, then click the Focus button. The selections you made display next to the word Segment in the status bar. The data updates in the Segment and the % of Market columns.
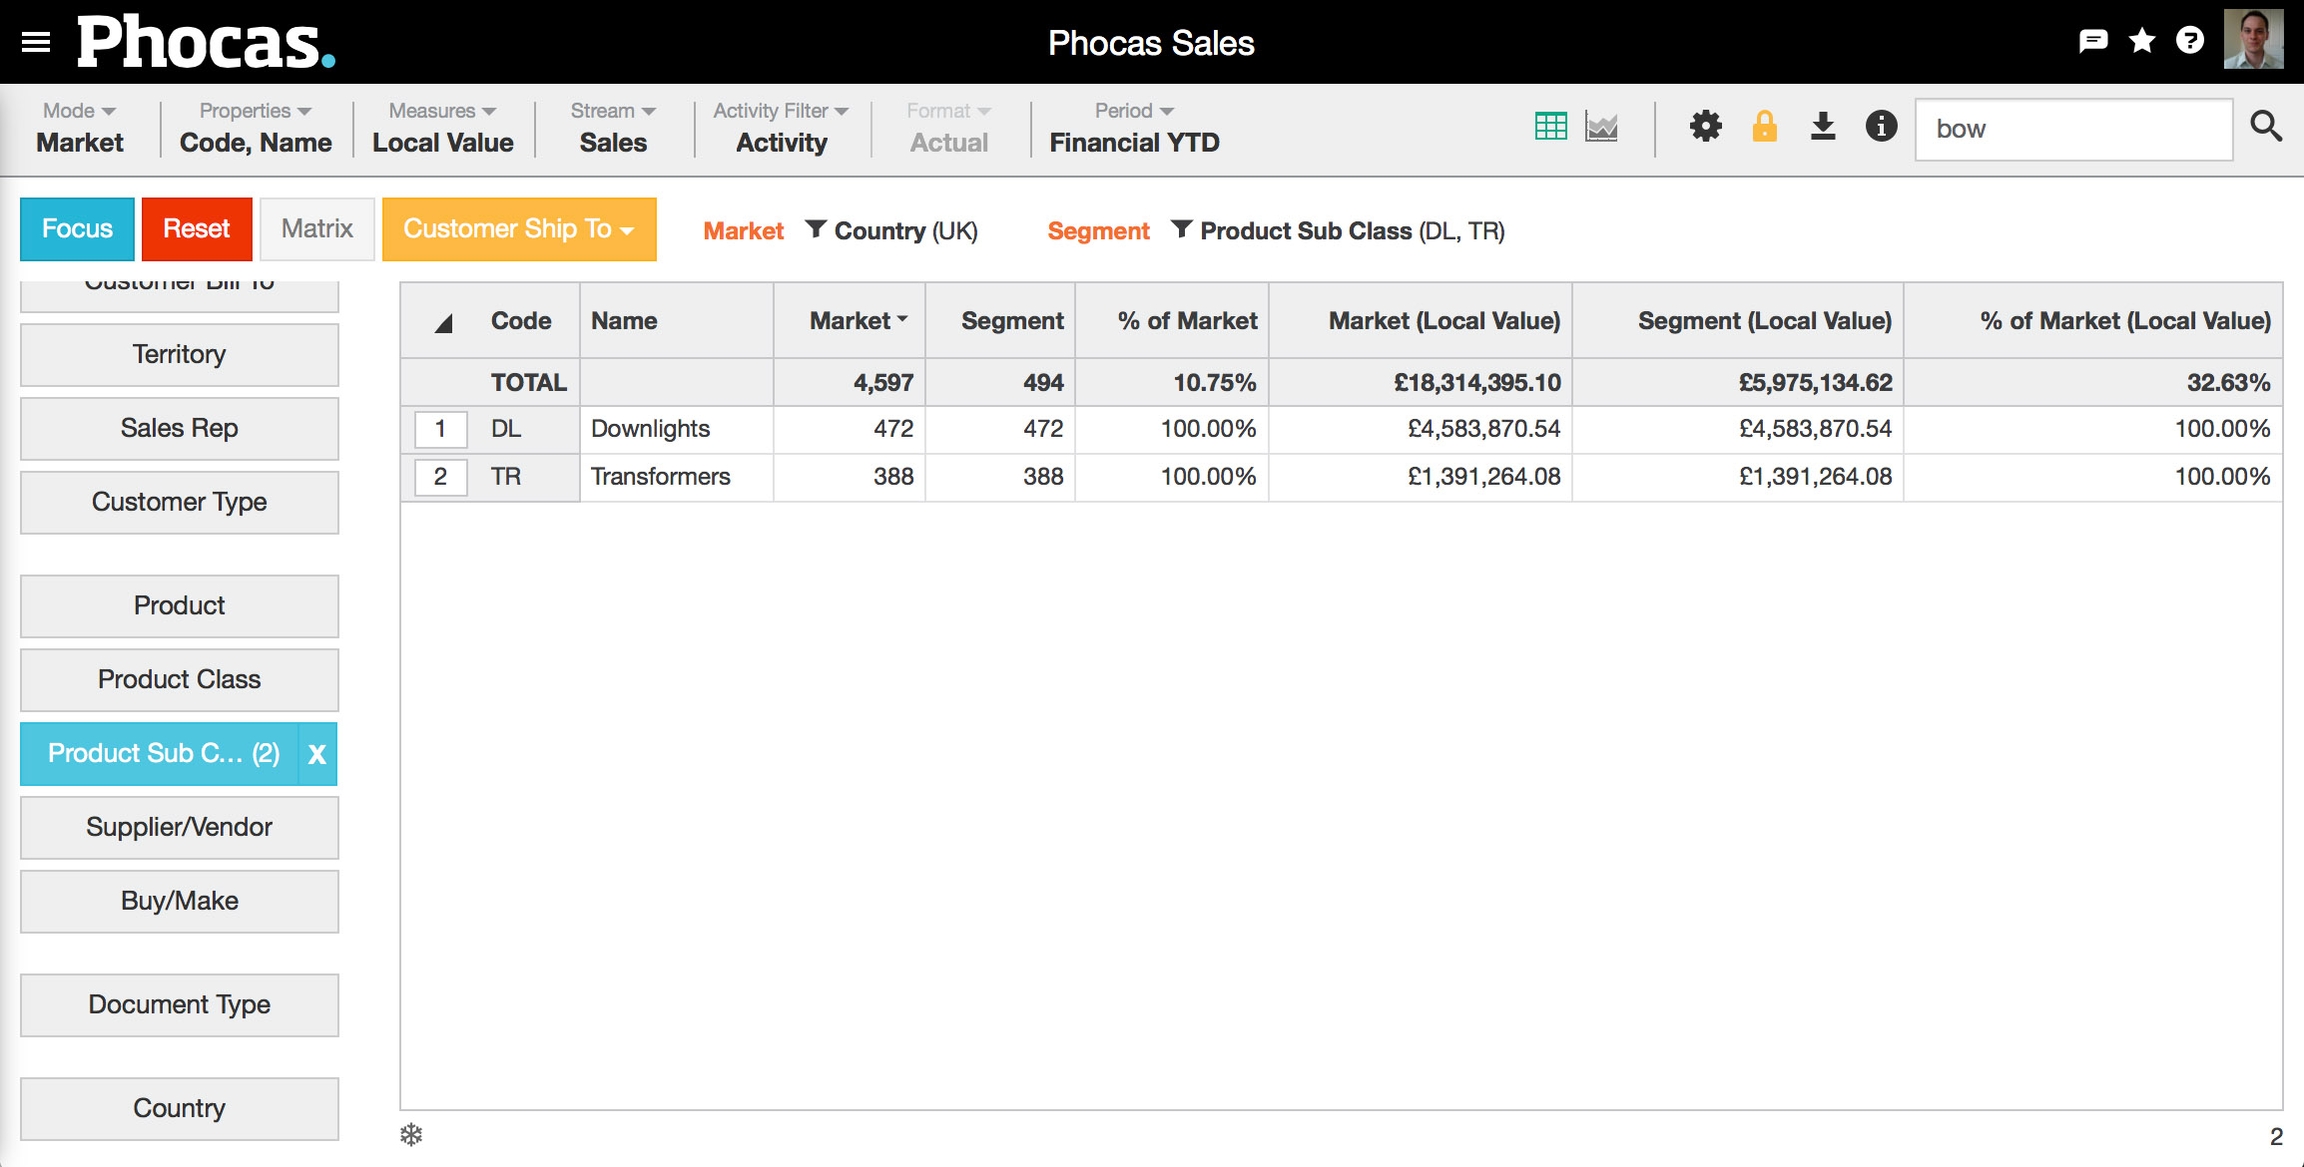
Define the market (select what you want to count): From the orange dropdown box, select the Customer Ship To dimension, so the number of customers defines the market.
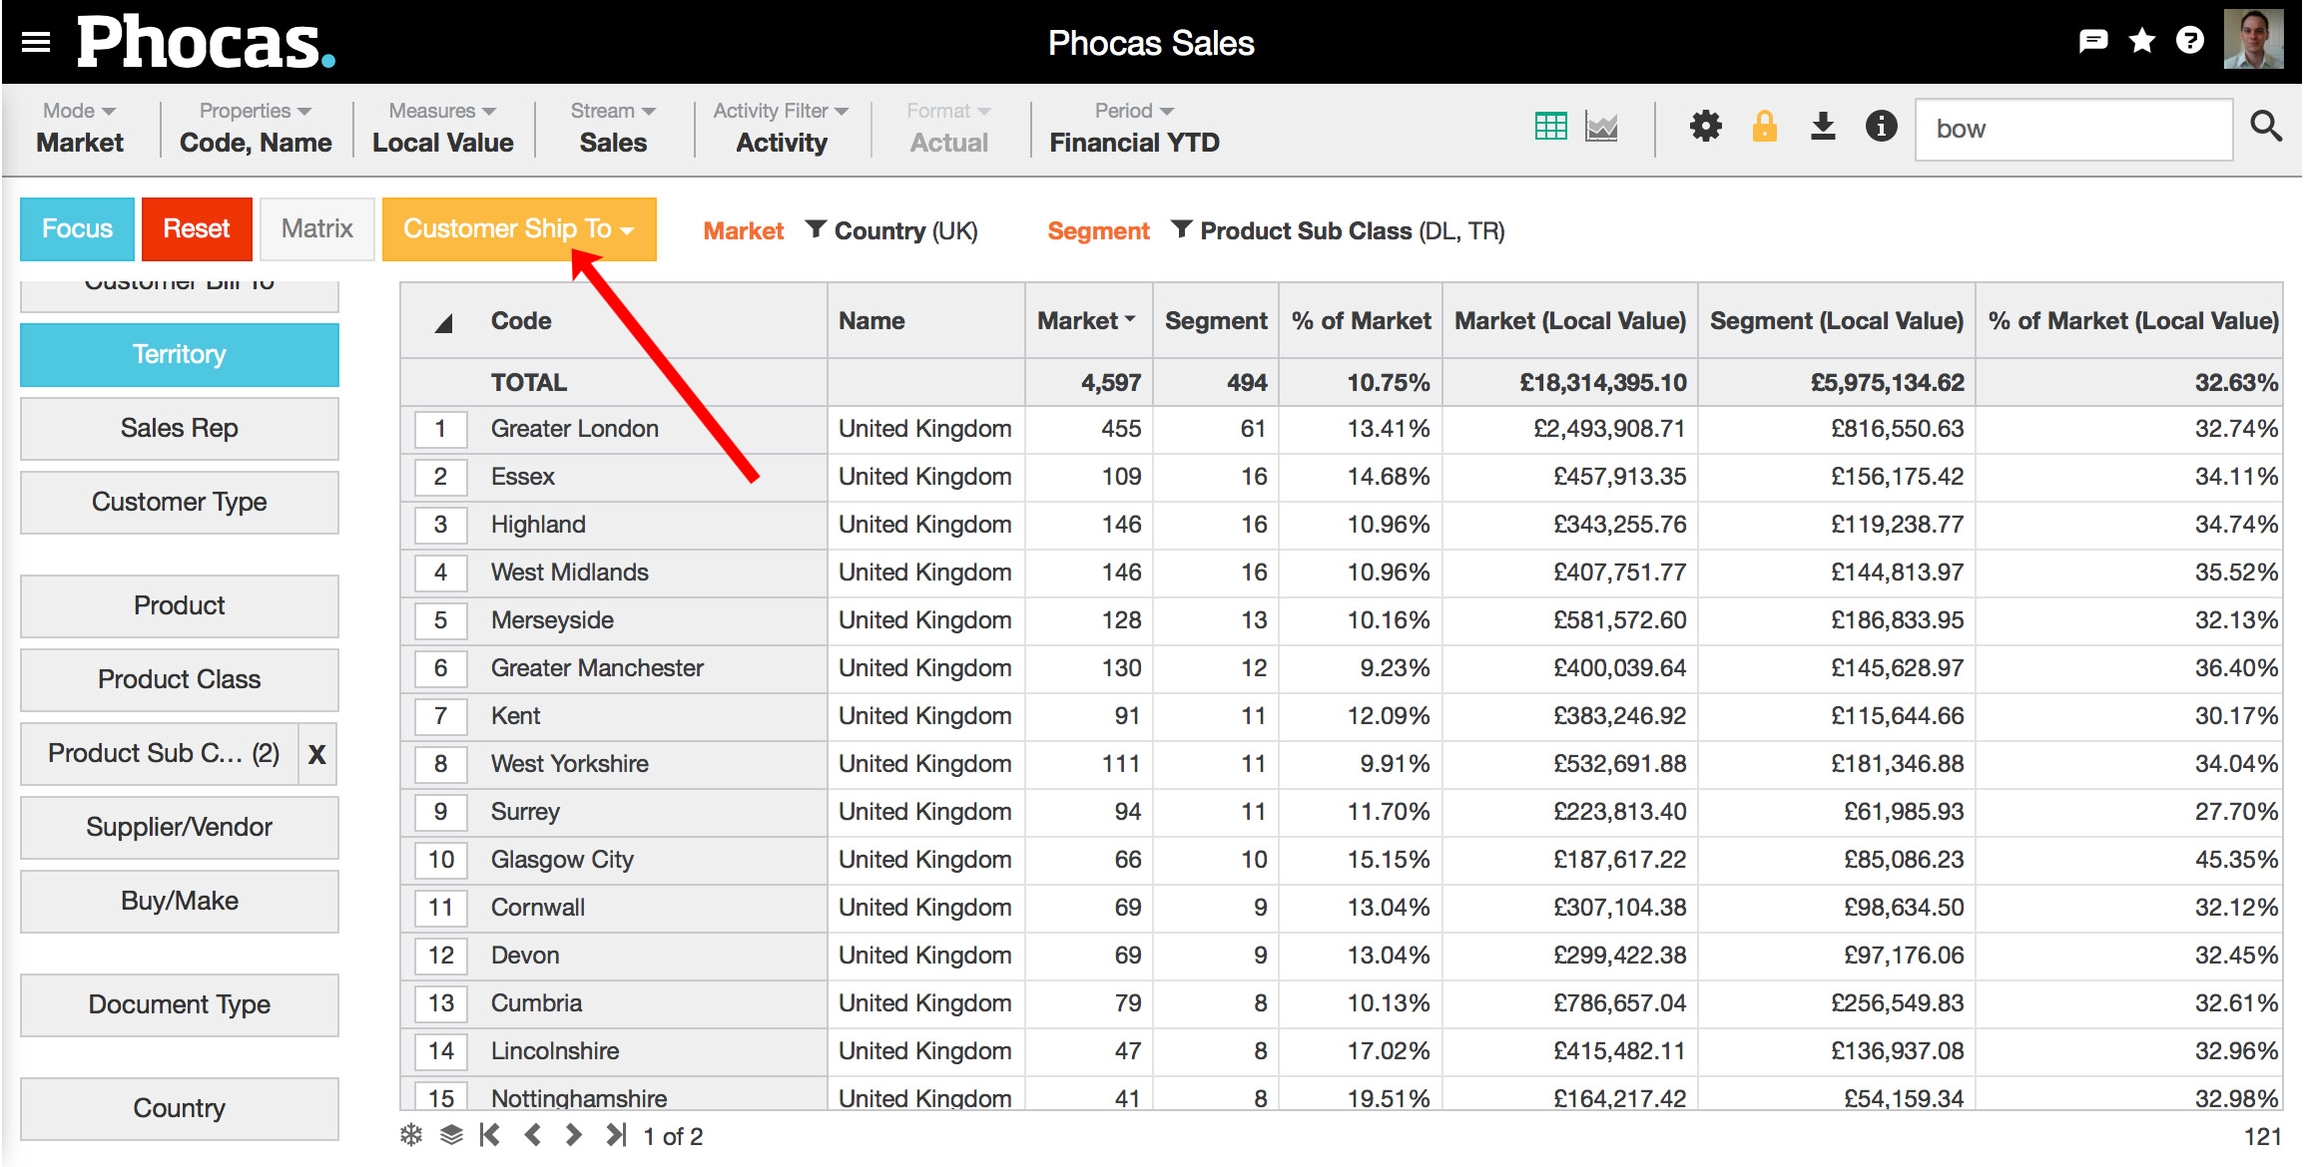
Prepare the grid for analysis: Click the Territory dimension, then click Measures > None to remove columns and simplify the grid.
View and analyze the results. For example, you can see that of the 109 customers in Essex, only 16 are purchasing in the selected segments (downlights and transformers).
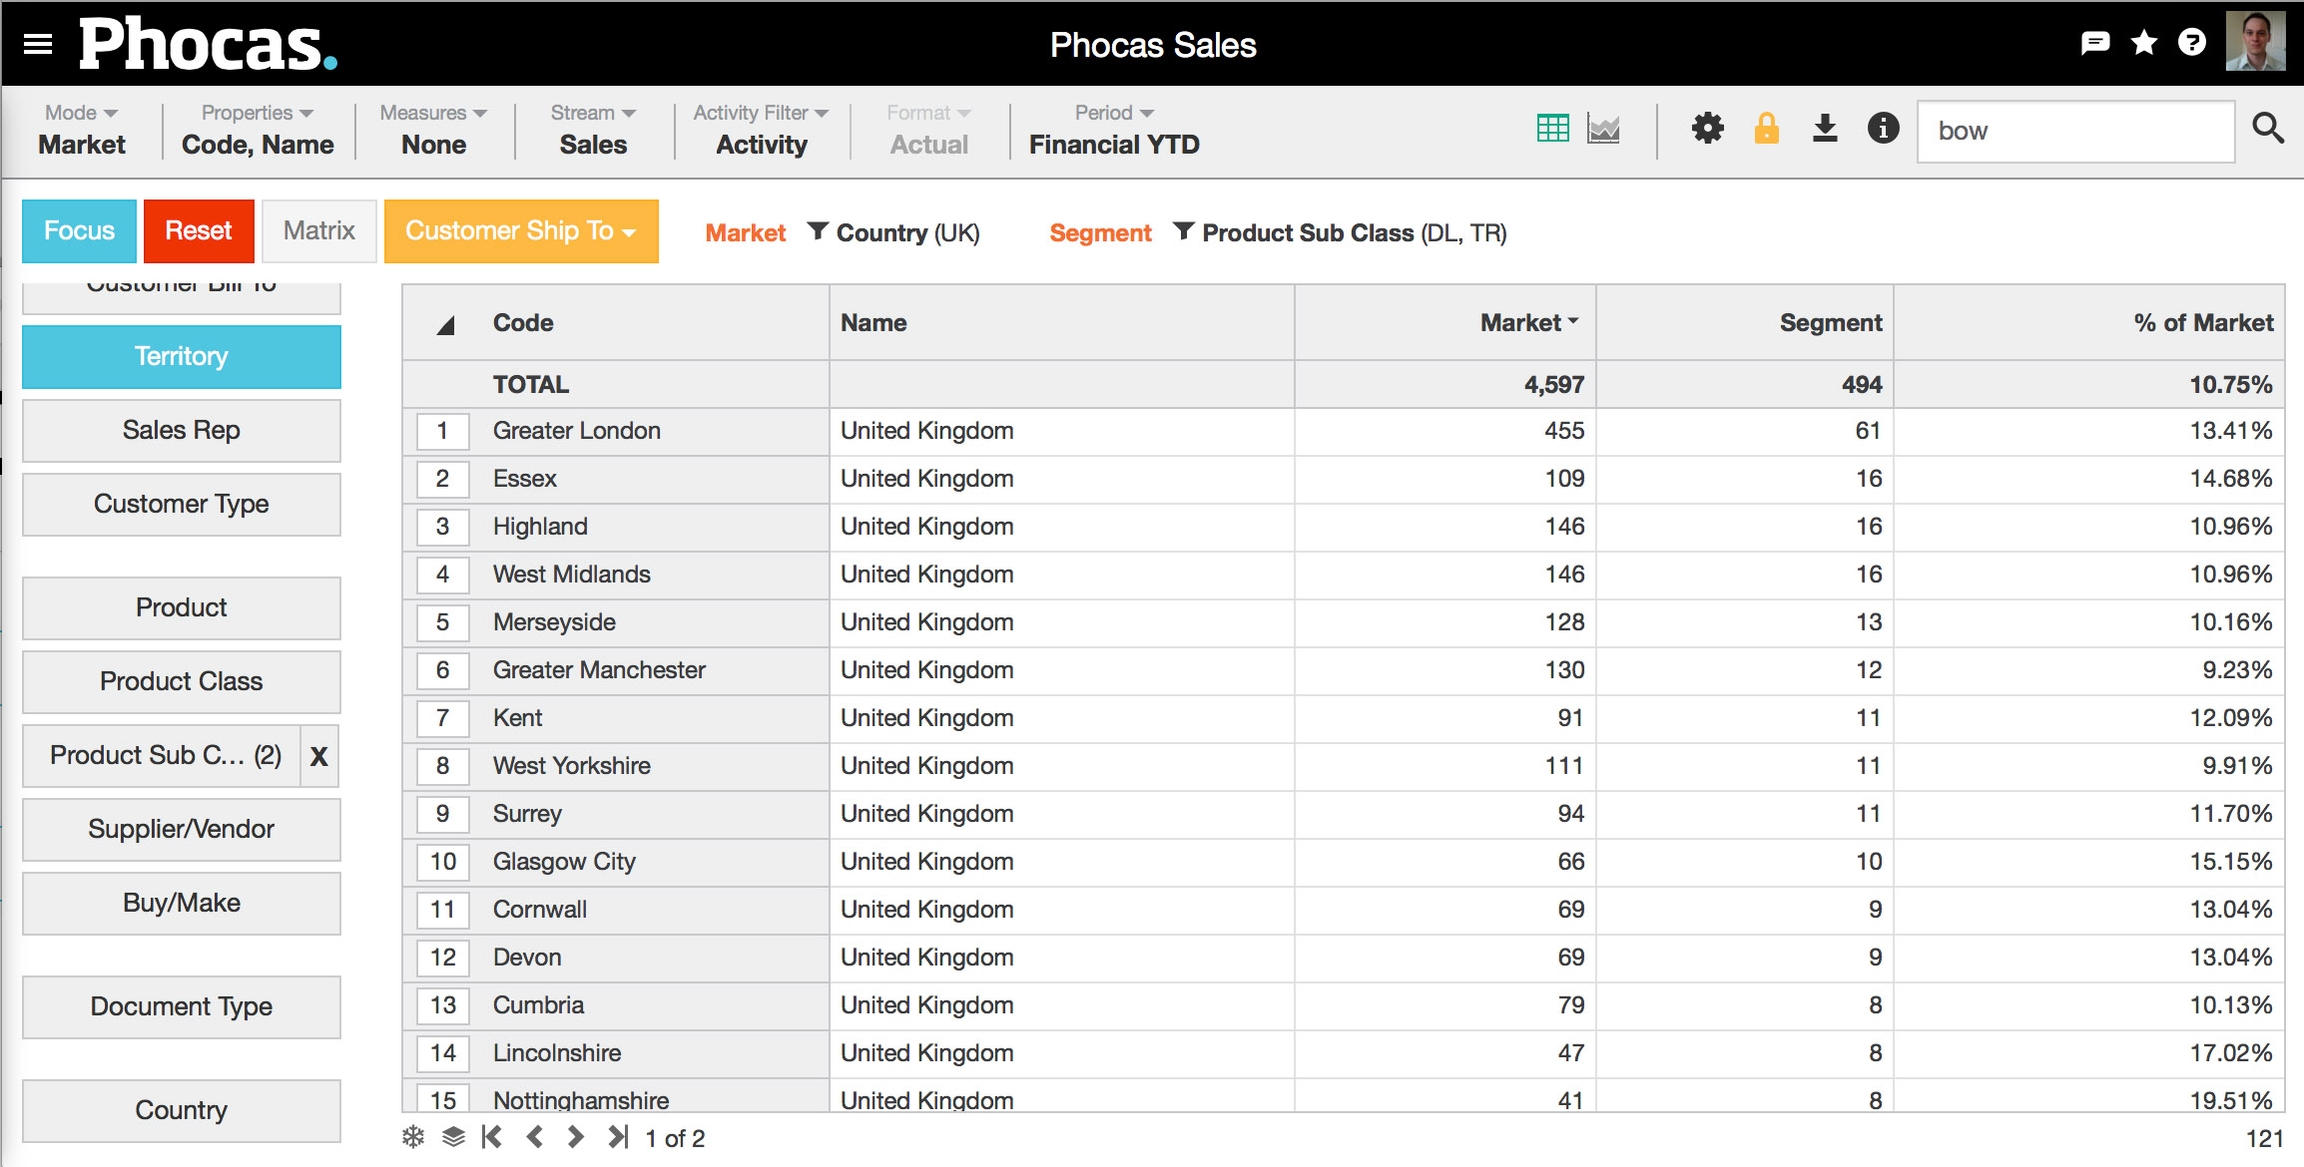
While still in market mode, you can change your segment by clearing the current selections and selecting and focusing on other data. The status bar will update accordingly. However, you can't change the market. To set a different market, you need to start again.
