
Use dimensions
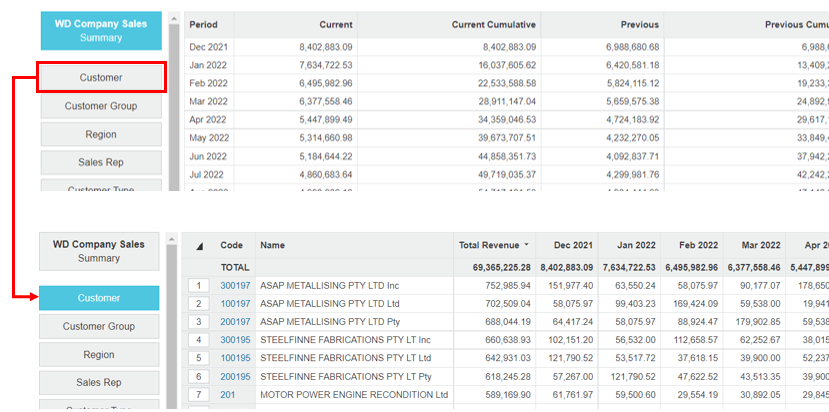
Switch from the summary to a dimension to get a different view of the data.
Click a dimension button to view its entities (rows) in the grid.
For example, suppose you are viewing your Sales database and want to look closer at your customers to see which customers generate the most sales revenue. When you click the Customer dimension, a list of customers displays in the grid.
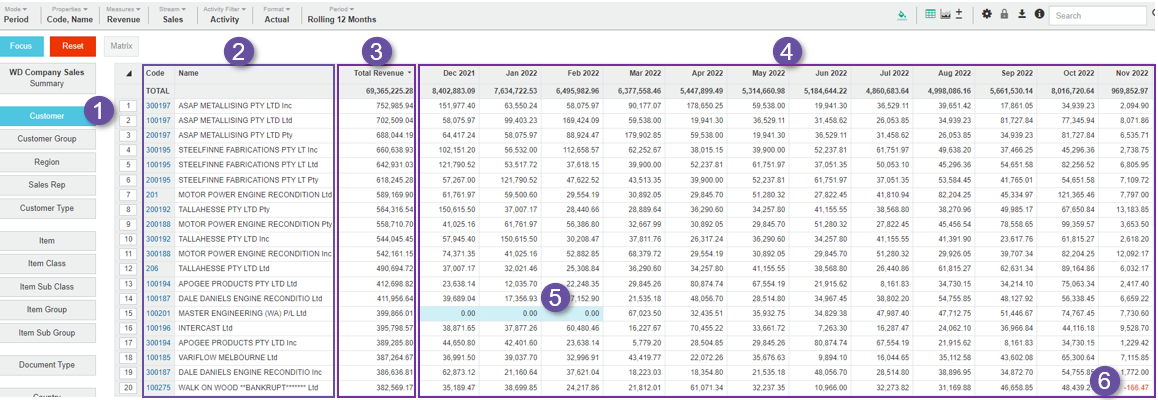
The grid now looks and behaves differently from when you're in the Summary view. The key characteristics are as follows:
The selected dimension is blue.
Properties (dimension metadata, such as Name and Code) display as columns. If the data in the Code column is blue, it indicates a link is available. You can select other properties to display or create your own custom property via the Properties menu.
Measures (data values relating to dimensions) are displayed as columns, for example, the Total Revenue or Current column. By default, the data is sorted by the first measure column in ascending order. You can then sort the data in other ways. You can change the measures and their format via the Measures menu.
Period columns display the related data for the selected period.
Cells that don't contain data are blue.
Negative figures are in red.
You can select rows and cells and focus on specific data to filter the dataset.
If you're looking at data from one dimension and want to switch to another, simply click the other dimension button. The grid updates to display the new dimension's entities.
See Work with the grid to learn how to sort data, freeze properties, view the record count, and more.
Last updated