LogoLogo
More help and supportPhocas website
  • Home
  • Getting started
    • Navigation
    • Homepage
    • Data access
    • User licenses, profiles and permissions
    • Account settings
    • Databases
    • Periods
      • Offset dates
      • Default period for a database
    • Sharing and folders
      • Share a dashboard, favorite, or alert
    • Subscriptions
  • Analytics
    • Take a tour of Analytics
    • Work with the grid
    • View a summary of the data
    • Customize your view (Analytics)
      • Change the mode
        • Period mode
        • Period Variance mode
        • Period Stream mode
        • Moving mode
        • Stream mode
        • Total mode
        • Transaction mode
        • Matrix mode
        • Matrix Variance mode
        • Matrix Share mode
        • Variance mode
        • Search mode
        • Market mode
        • Custom mode
      • Change the properties (Analytics)
      • Change the measures (Analytics)
      • Change the stream
      • Use the activity filter
      • Change the data format
      • Change the period (Analytics)
    • Drill down into your data (view transactions)
    • Filter data (use dimensions)
    • Select data (Analytics)
    • Focus on data (Analytics)
    • Copy or export data
    • Search for data
      • Perform a basic search
      • Perform an advanced search
      • Search for similar or comparative data (right-click filter)
    • Add levels to the grid (grid nesting)
    • Compare data with Matrix mode
    • Get more options for viewing data
    • Visualize your data in a chart
      • Bar and Column charts
      • Combo chart
      • Pareto chart
      • Waterfall chart
      • Line chart
      • Area and % Area charts
      • Pie and Donut charts
      • Bubble chart
      • Radar chart
      • Gauge chart
      • Bullet chart
      • Summary and Ring Summary charts
      • Map charts
      • Configure the chart options
      • Select and focus on a chart segment
      • Export a chart as an image
      • Use the chart legend
    • Save favorites and add to dashboards (Analytics)
    • Reset data
    • Phocas AI
  • Flex Modes
    • Switch modes
    • Change the period (Flex Modes)
    • Filter data (Flex Modes)
    • Apply conditional formatting
    • Create a nested view
    • Manage columns (Flex Modes)
    • Save and share a favorite (Flex Modes)
    • View your data in a chart (Flex Modes)
  • Financial Statements
    • Take a tour of Financial Statements
    • Overview of access to financial statements
    • Customize your view (Financial Statements)
      • Change the properties (Financial Statements)
      • Change the measures (Financial Statements)
      • Change the period (Financial Statements)
      • Change the streams and scenarios
        • Change the budget data
      • Change the columns
      • Change the style
      • Change the rows (activity filter)
    • Filter the financial information
    • Select and focus on data (Financial Statements)
    • Copy or export financial information
    • Add a level in a financial statement
    • View financial information in a matrix (change column groups)
    • Add and view comments (Financial Statements)
    • View transactions (Financial Statements)
    • View financial information in a chart
      • Create a Pie and Donut chart (Financial Statements)
      • Create a Value card
      • Export a financial chart widget as an image
    • Save and share favorites (Financial Statements)
    • Add financial analysis to a dashboard
    • Manage financial statements
      • Overview of financial statements and dimensions
      • Create a financial statement
      • Delete a financial statement
      • Customize a financial statement
        • Rename a financial statement
        • Reorder a financial statement
        • Customize account groups
        • Customize calculations
          • Functions for Profit & Loss calculations
          • Formulas for financial ratios
        • Customize headings and spacers
        • Set the revenue row in a Profit & Loss statement
        • Customize columns
        • Customize a Cash Flow statement
          • Common account mapping for Cash Flow statements
        • Rebuild the database
      • Set the financial year end date
      • Map the Retained Earnings account(s)
      • Restrict access to accounts
      • Manage streams and scenarios
        • Manage budget streams (Financial Statements)
      • Create a budget (Financial Statements)
      • Use statistical streams
      • Use multiple currencies
      • Manage dimension groups
      • Map categories from your Chart of Accounts
  • Budgets & Forecasts
    • Overview of key terms and concepts
      • Budgets versus forecasts
      • Users and data access
      • Relationship with the Financial Statements module
      • 3-statement budgeting
      • Filtering methods
      • Demand planning
      • Loan repayments
    • Take a tour of Budgets & Forecasts
      • Explore the budget workbook
      • Explore the forecast workbook
      • Explore the Balance Sheet and Cash Flow budgets and forecasts
    • Customize your view (Budgets & Forecasts)
      • Filter a worksheet (search for items)
      • Group period columns
      • Use layouts
    • Use session filters
    • Edit values in a worksheet
      • Open workbook notes
      • Use keyboard shortcuts
      • Copy and paste values
      • Use comparison rows
      • Use sum and working lines
      • Use formulas
      • Spread totals
      • Revert to the baseline values
      • Edit the Balance Sheet budget
      • View and use headcount data
    • Refresh a workbook
    • Use workflows
      • Contribute to the workflow
      • View the workflow history
      • View workflow comments
    • View budget information in a chart
    • Open baseline, comparative, or opening balance data
    • Review the budget or forecast
      • Add and view cell comments
      • View and restore the cell history
      • View the audit log
      • Compare actuals, budgets and forecasts
    • Export a workbook or worksheet tab
    • Manage budgets and forecasts
      • Create a budget workbook
        • Best practices for efficient budgeting
        • Filtered budget or forecast
        • Budget by region and branch
        • Multi-currency budget
        • Unclassified data
        • Period types in budgets
        • Additional measures for driver-based budgeting
      • Create a forecast workbook
      • Clone a workbook
      • Import a budget or forecast
      • Edit the workbook setup
      • Roll a budget forward
      • Add more detail to a budget or forecast
      • Add worksheet tabs (drivers)
        • Balance Sheet and Cash Flow tabs
        • Manual Entry tab
        • Database tab
        • Headcount tab
          • Headcount tab FAQs
        • Reference tab
        • Lookup tab
        • Allocations tab
        • Scratch Pad tab
      • Manage worksheet tabs
      • Add notes to a workbook
      • Customize the format of measures
      • Manage the workflow
      • Manage user access and notifications
      • Publish a budget, forecast or other worksheet tab
      • Fix the baseline in a budget
      • Delete or restore a workbook
      • Delete a stream (Budgets & Forecasts)
  • Rebates
    • Overview of rebates
    • Get started with Rebates
    • Projects
    • Rules
      • Parent-child rebate rules
      • Rebates calculation methods
      • Yearly rebates
      • Quarterly rebates
      • Monthly rebates
      • Whole rule period rebates
      • Retrospective rebates
      • Pro rata rebates
    • Calculations
      • Run a calculation
      • Schedule calculations
      • View calculation results and transactions
      • Post calculation results
    • Seasonal calendars
    • Rebates analysis
    • Rebates near miss analysis
  • CRM
    • Overview of CRM
    • Agenda
    • Contacts
    • Accounts
    • Leads
    • Activities
      • Microsoft 365 Outlook calendar integration
    • Campaigns
    • CRM analysis
    • CRM administration
  • Favorites
    • Save a favorite
    • Manage favorites
    • Set a favorite as your default view
    • Use alerts
  • Dashboards
    • Use dashboards
    • Create a dashboard
    • Set a dashboard as your homepage
    • Manage dashboards
  • Administration
    • Overview of access to data (Administration)
    • Users
      • Add, update or delete a user account
        • User maintenance form
        • User permissions
      • Create a user template
      • Manage a user's database access and restrictions
      • Manage user passwords
      • Monitor user activity
      • Lock user accounts
      • Impersonate a user
    • Profiles
    • Folders (Administration)
    • Favorites (Administration)
    • Dashboards (Administration)
    • Subscriptions (Administration)
    • Periods (Administration)
      • Period types
      • Working days
    • Databases (Administration)
    • Sync Sources
    • Connectors
    • Configuration
      • Set up SSO
      • Set up SSO with Microsoft Entra ID
    • Logs
    • Designer
      • Modify a database
      • Get your data into Phocas
      • Design a database
        • Create a database
        • Add (connect) data to a database
        • Map data to the database
        • Save your database design
      • Design a financial database
      • Build a database
      • View and revert to older design versions
      • Add a budget file to a financial database
      • Add a budget file to a non-financial database (easy budget upload)
    • Sync
      • Automatically join or split items during Sync (split view)
      • Schedule the sync process
      • Migrate Sync
      • Test the sync process
    • Reserved words and characters
    • End of year maintenance tips
  • OTHER INFORMATION
    • File upload
    • Encrypt (share secrets)
    • Glossary
    • Release notes
      • Analytics release notes
      • Flex Modes release notes
      • Financial Statements release notes
      • Budgets and Forecasts release notes
      • Rebates release notes
      • Administration release notes
    • System requirements
    • Technical limitations
    • Security information
    • Scheduled upgrade and maintenance periods
    • More help and support
Powered by GitBook

© Phocas Software

On this page
  • Use the activity filter
  • Hide the current year earnings in a Balance Sheet

Was this helpful?

  1. Financial Statements
  2. Customize your view (Financial Statements)

Change the rows (activity filter)

PreviousChange the styleNextFilter the financial information

Last updated 3 months ago

Was this helpful?

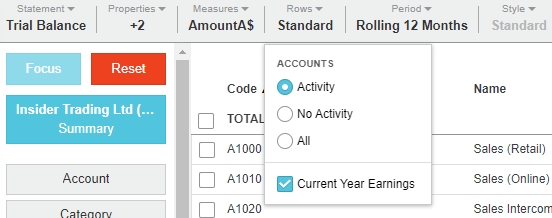
The Rows menu allows you to show or hide the items with activity, determining which rows are displayed in the financial statement and giving you a simple way to identify active or inactive items. In a Trial Balance statement, you can also show or hide the Current Year Earnings row.

The behavior of the Rows menu is consistent with the Analytics nested grid, as it shows the result for the first dimension, which in Financial Statements is the Statement Group category.

The options in the Rows menu might be different depending on the database you are analyzing. Your administrator can the option labels in Designer to meet your business requirements. The labels are usually in the context of Activity, No Activity, or All.

Use the activity filter

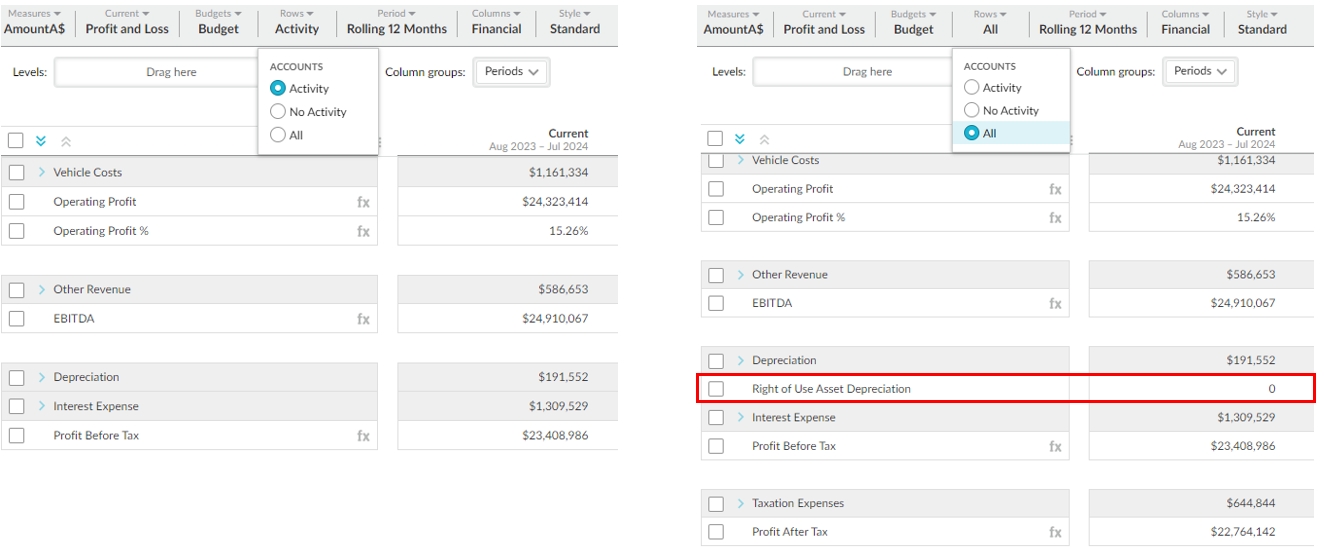
Use the Rows menu as an activity filter to switch between viewing rows with Activity, No Activity, and All (items with both activity and no activity)*.

  • Activity: Only the items for which there have been transactions in the selected period and where the result is not zero. Typically, this is the default view.

  • No Activity: Only the items with no transactions in the selected period. The results depend on how up-to-date your source data is. For example, you might see items that have been discontinued or those that had no activity within the period.

  • All: Combines the other two options to show all accounts, regardless of whether a transaction has occurred. For example, in the second image below, there’s a statement group called Right of Use Asset Depreciation, which would previously not have shown in the selected period, as the transaction values are nil.

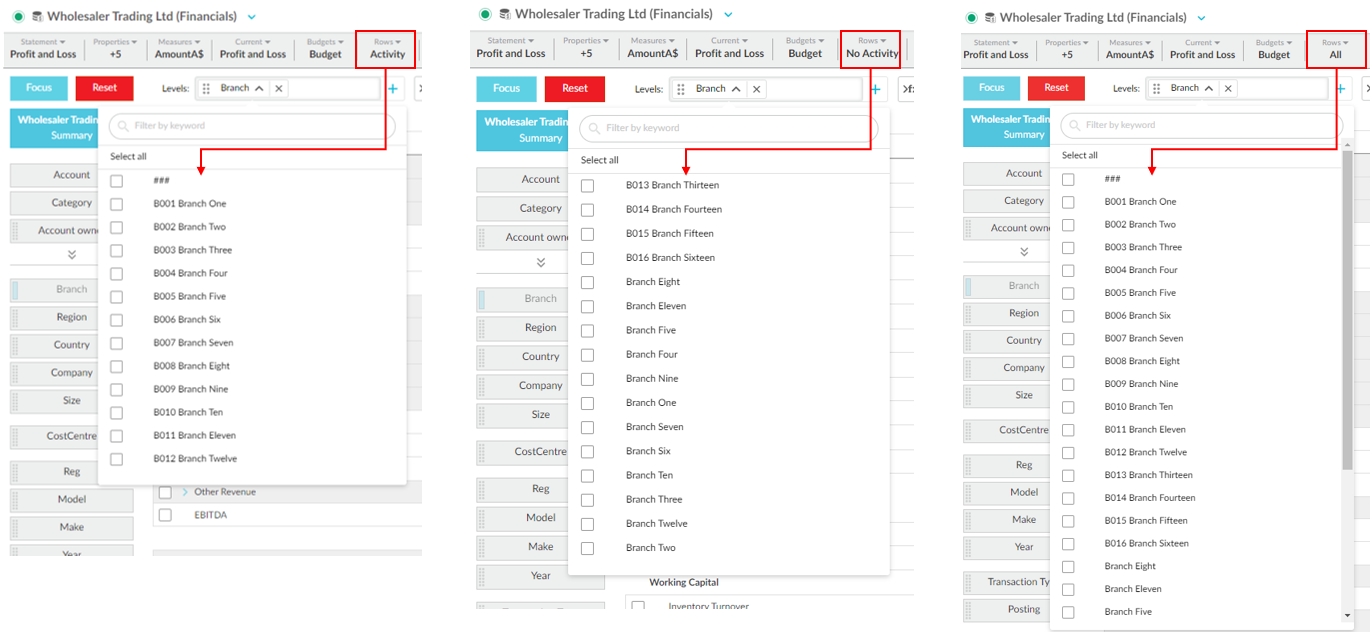
When adding levels to the statement, the Levels box references the activity filter and updates as follows:

  • When Rows > Activity is selected, the list contains items with activity.

  • When Rows > No Activity is selected, the list contains items with no activity.

  • When Rows > All is selected, the list contains all items with and without activity.

All of the items in the list are selectable.

Hide the current year earnings in a Balance Sheet

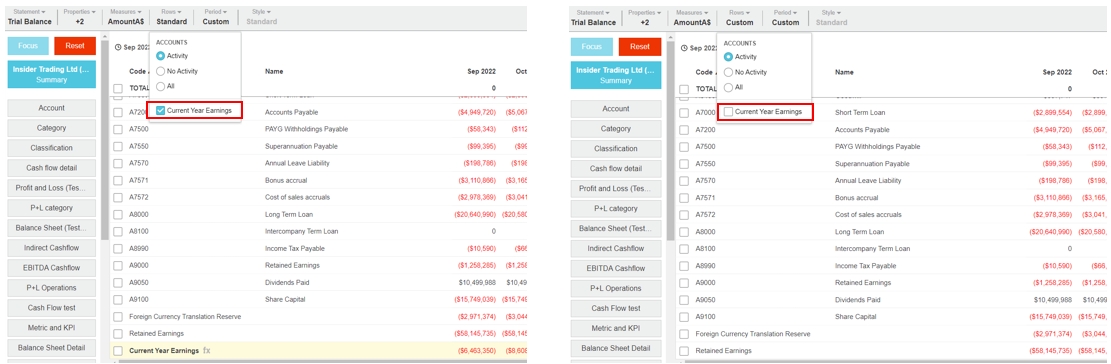
By default, the current year earnings row displays on the Trial Balance statement, but you can hide it from view.

Click the Rows menu and clear the Current Year Earnings checkbox. Your selection persists in favorites and dashboards.

customize
image-20240724-212513.png
image-20240724-233844.png