Filter data
Use dimensions to narrow down the financial data and analyze performance in more detail.
See these related pages:
Dimensions: General information about dimensions, a core concept in Phocas.
Overview of financial statements and dimensions: Information about the link between dimensions and Financial Statements.
Instead of only looking at the high-level totals in your financial statements, you can filter the data. For example, you might want to view figures by department, region, or product line.
You can filter your financial data directly in the Financial Statements module, or start there and move into the Analytics module.
Filter directly in Financial Statements
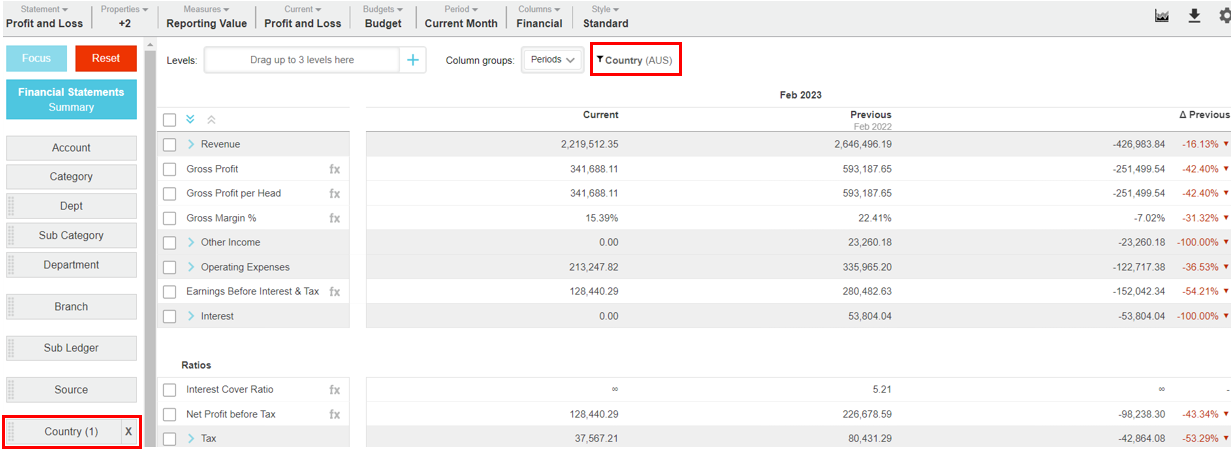
The fastest way is to drag a dimension into the Filters drop zone, then select the items you want to filter by using the drop-down menu. The selected filters appear above the grid so you can easily see which criteria are applied.

Filter using the Analytics module
In Financial Statements, click the dimension you want to use as a filter, such as Country, Branch, Department, and so on. You move into the Analytics module, where you'll notice some of the menu items change and the Summary button turns grey. The Analytics grid displays a summary of performance for each entity in the selected dimension.

From here, you have two options:
Use the range of Analytics tools to drill deeper into your data, all the way down to the transaction level. See the Analytics pages for detailed information.
Select one or more entities in the grid, then click the Summary button to return to the Financial Statements module and view the filtered statement. The filter you apply displays above the grid, and the number of selected entities displays on the corresponding dimension button.
Expand the sections below for more examples.
Example 1: Filter a financial statement to view the performance of one branch
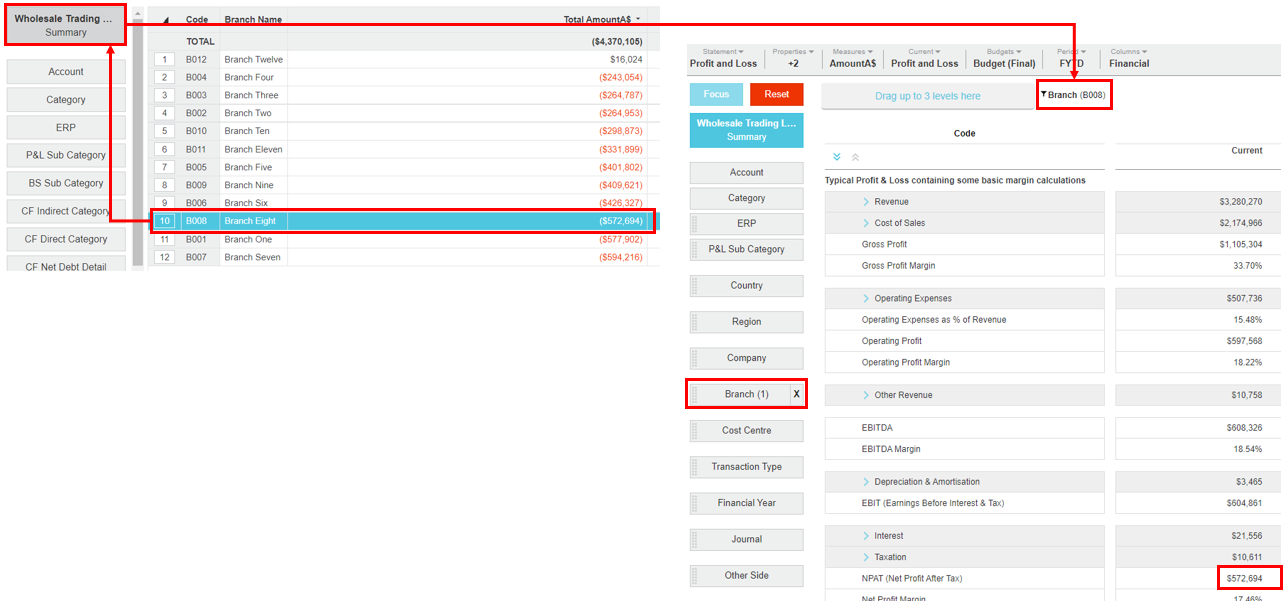
In the financial statement, click the Branch dimension, then in the Analytics grid, select the branch (B008) and click the Summary button.
The statement grid now displays the Profit and Loss for branch B008.
Example 2: Filter a financial statement to view the performance of multiple branches
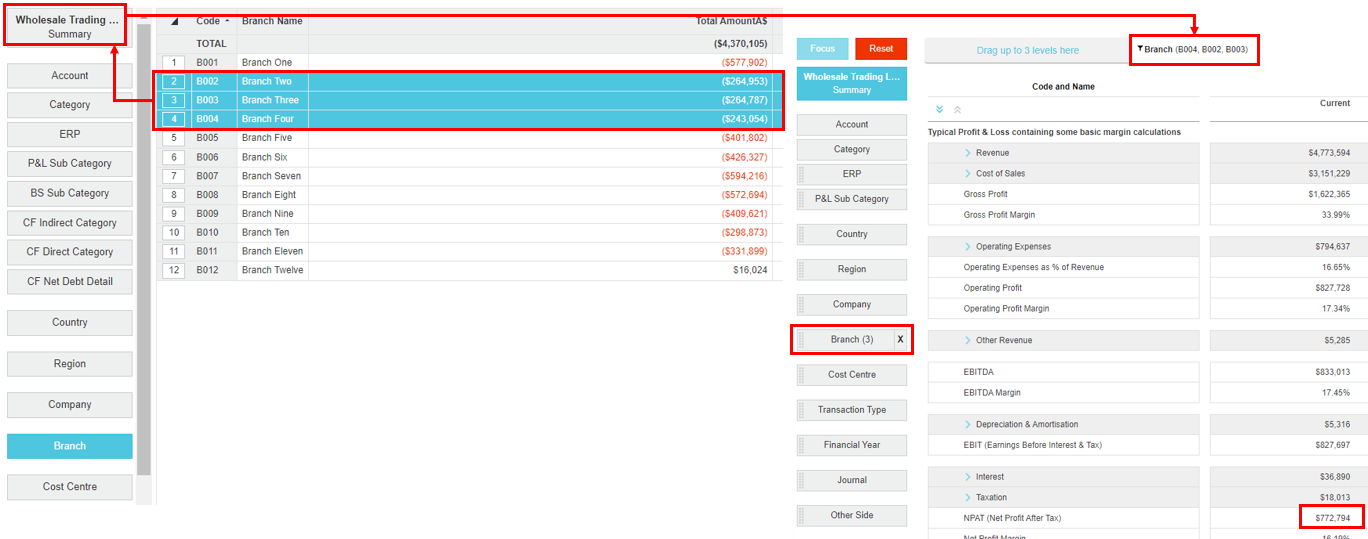
In the financial statement, click the Branch dimension, then in the Analytics grid, select the branches (B002, B003 and B004) and click the Summary button.
The statement grid now displays the combined Profit and Loss statement for the selected branches. The net profit value is the sum of the net profits of those branches.
Example 3: Filter a financial statement to view the performance of multiple cost centres in a branch
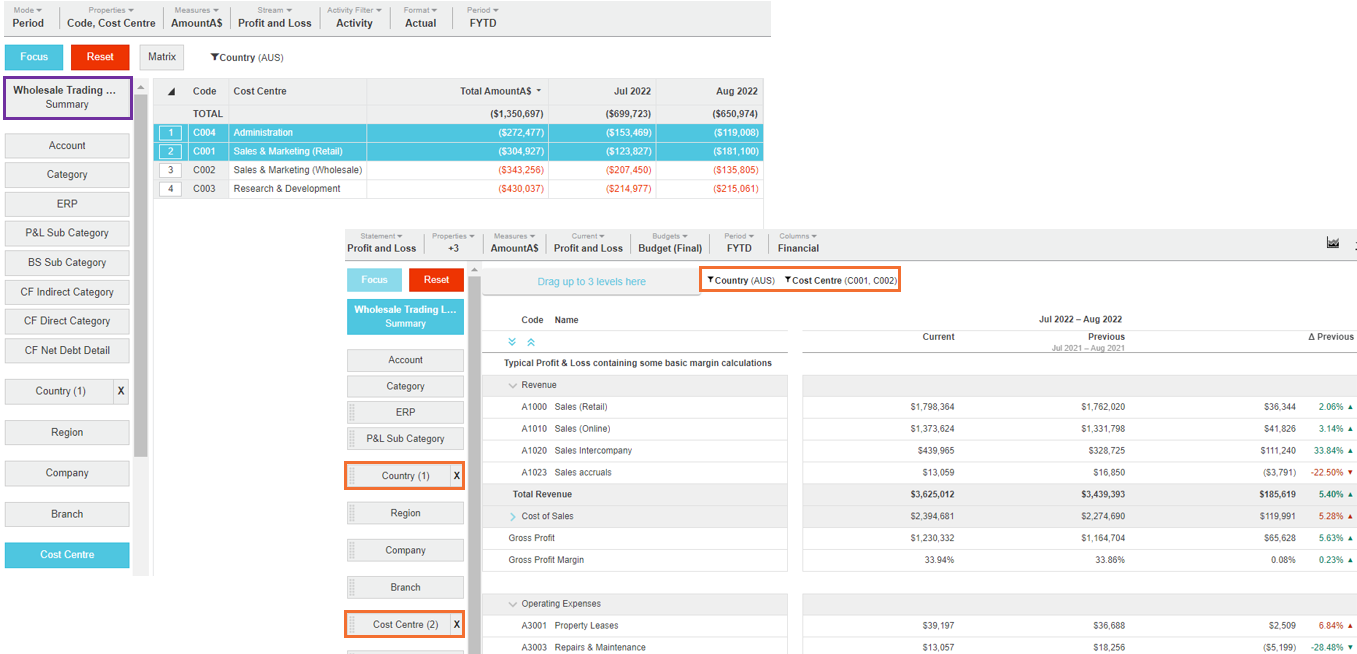
Suppose you have filtered the Profit and Loss statement by Country (dimension) > Australia (entity). Now you want to take your analysis a step further and see how two specific cost centres in Australia are performing.
In the filtered financial statement, click the Cost Centre dimension.
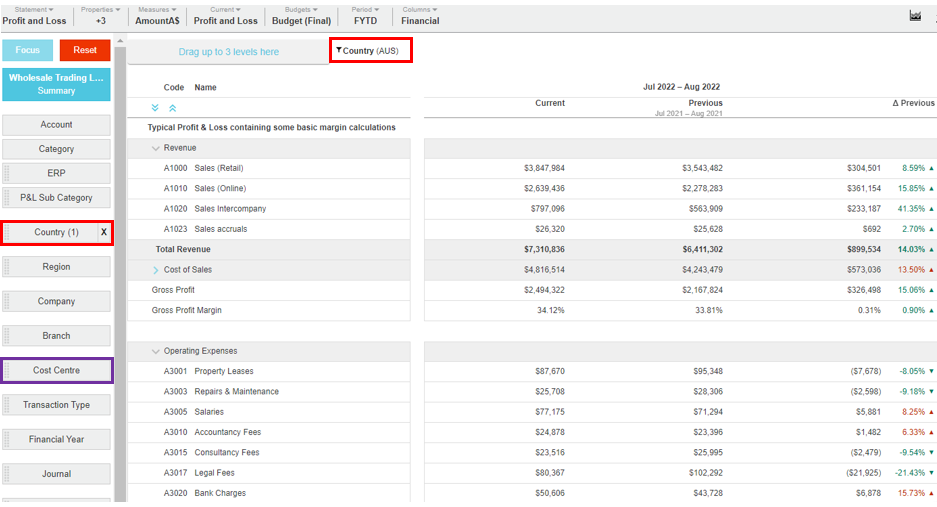
In the Analytics grid, select the cost centres (C001 and C004) and click the Summary button.
The statement grid now displays the combined Profit and Loss statement for the selected cost centres in Australia. The net profit value is the sum of the net profits of those cost centres.
Remove a filter
To remove a filter and return to the high-level summary financial information, click the X in the filter chip or on the dimension button.
To completely reset the data, click the Reset button.
Last updated
