
Manage dimension groups
Customize your dimension groups to enhance the analysis capabilities in your financial statements.
If you use the Budgets & Forecasts module, take care when making any changes in Financial Statements, as you risk losing budget values. See the Relationship with the Financial Statements module page to learn about the impacts of making changes to statements. It's a good idea to publish your budgets and forecasts before you make any changes here.
You can change the name of a group to something more descriptive, delete a group that is no longer in use, or add a new group to meet your business needs. You can also export the group data for validation with other sources.
As dimensions are a way of grouping data, additional dimension groups are useful for many reasons, but they’re particularly valuable:
If your business has a long list of things, such as lots of departments or cost centers. For example, you could create groups for each type of store (franchise or independent) or each size of store (small, medium, or large).
If your business is project-based. You can have individual groups for each project.
If you want to analyze consolidated results. You might want to group your entities in a certain way to help with your analysis.
If you want to reclassify items, something that might be unavailable in your ERP.
Your changes to the dimension groups are saved in the underlying database design and, therefore, available to all users with access to that database. Your dimension groups are included in favorites and dashboards and are also available for use in the Analytics module.
Get started with groups
You start in the same way, whether you are adding groups to create new dimensions, editing existing groups, or simply viewing a group's composition.
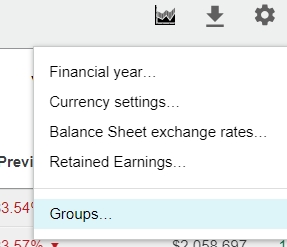
Open the Groups window: Click the Settings button > Groups in the top-right corner.
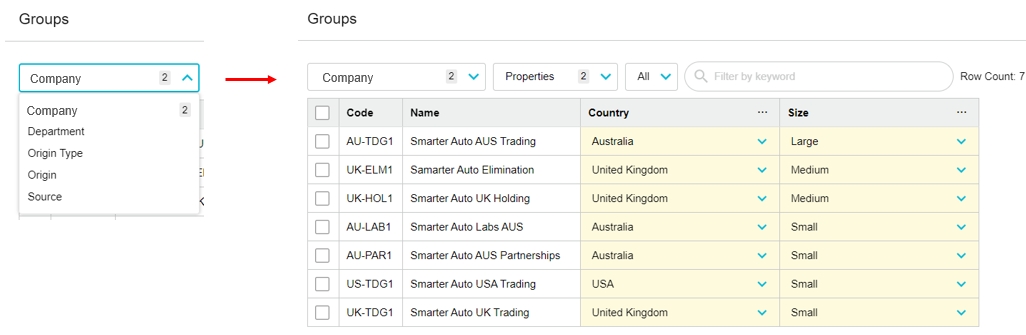
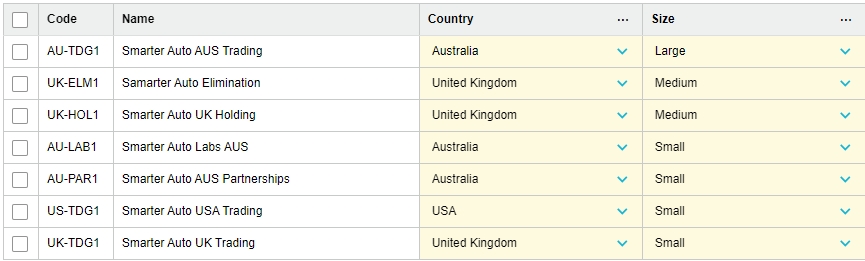
Select the top-level dimension for which you want to manage groups, for example, Company. Each entity in that dimension is displayed as a row in the grid. If any dimension groups exist for that dimension, they are displayed as columns in the grid. In the following image, the Company dimension has seven rows (entities) and two groups: Country and Size. The top-level dimension entities are assigned to an entity in each group.
When managing your groups, use the Undo and Redo buttons in the top-right corner to save time when you need to undo or redo the following actions: enter or import data, and create, clone, rename, or delete columns.
Find specific entities (sort and filter)
The example above is very basic. It’s likely that your top-level dimensions contain many entities, and therefore, there are many rows in the grid. If there are a lot of entities, to manage the groups more easily you can:
Click a column header to sort the items by that condition in ascending or descending order.
Use the filters to limit the number of items that are displayed in the grid:
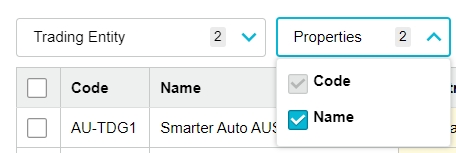
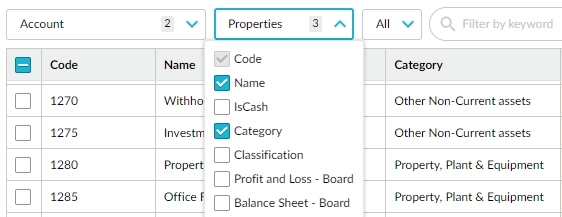
Properties: Properties give you information about the dimension, which helps you to assign the entities to the applicable group entities. Select the checkboxes of the properties you want to see in the grid.
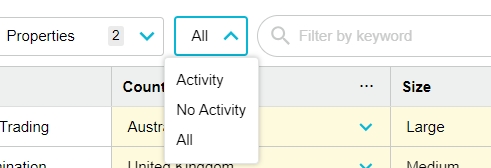
All (activity): The dimension might contain entities for which there are no transaction activities. It is still possible to map such entities. Select Activity, No Activity, or All as required.
Keyword: The search box above the grid allows you to find a particular dimension entity row quickly. As you type a keyword, the grid contents are filtered to display only the items that match. Often you don’t need to enter a whole keyword, as the search results are so fast. There's also a search box in the filter in each dimension column header.
Dimension entities: The filter button in the header of each dimension group column allows you to filter for:
Specific entities: Click the All filter button, then select the checkboxes of individual entities you want to focus on. Only those entities are displayed in the grid.
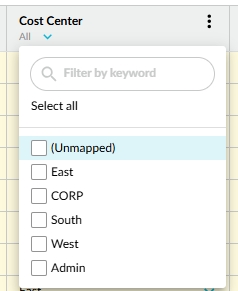
Mapped and unmapped entities: To make the mapping process easier, click the All filter button and select Unmapped. Only the unmapped entities (the entities you have yet to assign to the group) are displayed in the grid. To view all the mapped items again, clear the Unmapped checkbox.
Add a group
You can add a new dimension group from scratch or clone an existing group to save time and reuse the data for another group. Alternatively, you can import the dimension group and entity data.
Watch the PUG Training video Financial Statements 101 for a demonstration of adding a dimension group called Consolidated Trading Entity with a custom sort order that's then used to add a level in the statement for analysis purposes (jump to 13:00)
Clone a group
Cloning is useful when you want to create a new group that’s very similar to an existing group. For example, if you have a group that updates each year, such as Market Strategy, you can clone that group and append its name with the year, then reassign the dimension entities in the group as required.
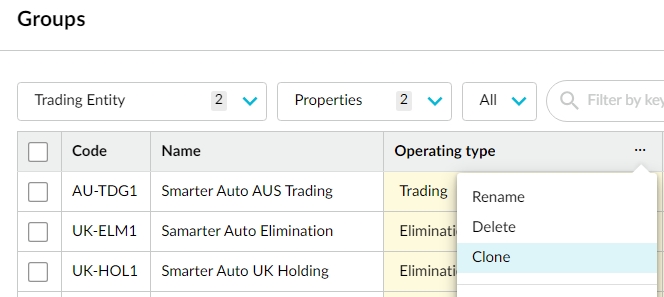
In the Groups window with the required top-level dimension selected, click the menu button in the column header of the group you want to clone and select Clone. The new group column (clone) with a default name is added to the grid. Proceed to edit the group.
Add a new group from scratch
In the Groups window with the required top-level dimension selected, click the Add button. A new group column with a default name (Dimension 1) is added to the grid.
Change the group’s default name to something more meaningful, for example, Country. Click the menu button in the column header and select Rename. The header becomes editable. Overwrite the default name and click out of the header to apply your changes.
Assign the applicable top-level dimension entities to entities in the group:
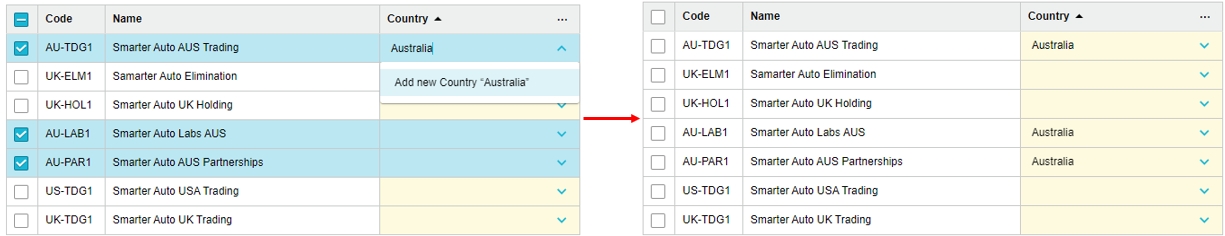
Save time by assigning multiple dimension entities to a group entity at the same time. Use the sort and filter tools (see section above) to locate the specific items, then select their rows (click and drag to select all rows in a series).
Type the new dimension entity's name into the yellow box in the group column and press Enter. In this example, you select the three Australian company rows and type Australia (entity) into the Country (group) column.
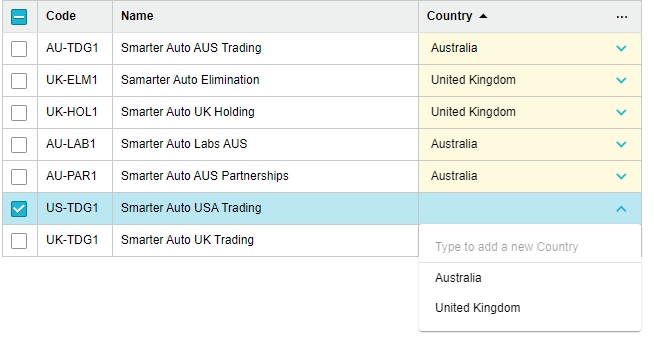
After you add one or more dimension entities to the group, you can select from that list of entities when assigning the subsequent top-level entities to the group.
Repeat the above steps (1 to 3) to add more groups and assign the applicable dimension entities. In this example, you add another group for the size of the company, which can be small, medium, or large.
Select one of these options:
Click Save and close to save your changes without triggering a database build. Your changes will take effect on the next database build.
Click Build Now to rebuild the database immediately and apply your changes. After a successful build, you’ll receive a message asking you to refresh the page, and then you’ll see the new dimensions.
Import groups
Rather than manually adding or editing your group data, you can import it from a Microsoft Excel file. The best starting point is the group export file (see Export groups below) for a dimension, which acts as a template to work from. You can edit the data in the file as required, such as add new groups and dimension entities or change the group-entity assignment, then import the file to quickly update your group data.
In the Groups window, with the required top-level dimension selected, ensure there’s at least one group column in the grid. If there are no group columns yet, add a blank column and give it a more meaningful name it (or you can rename it later).
Open the exported file in Microsoft Excel, make your changes, then save and close the file.
In the Groups window, with the required top-level dimension selected, click Import in the bottom-left corner.
Locate and select your file, then click Open.
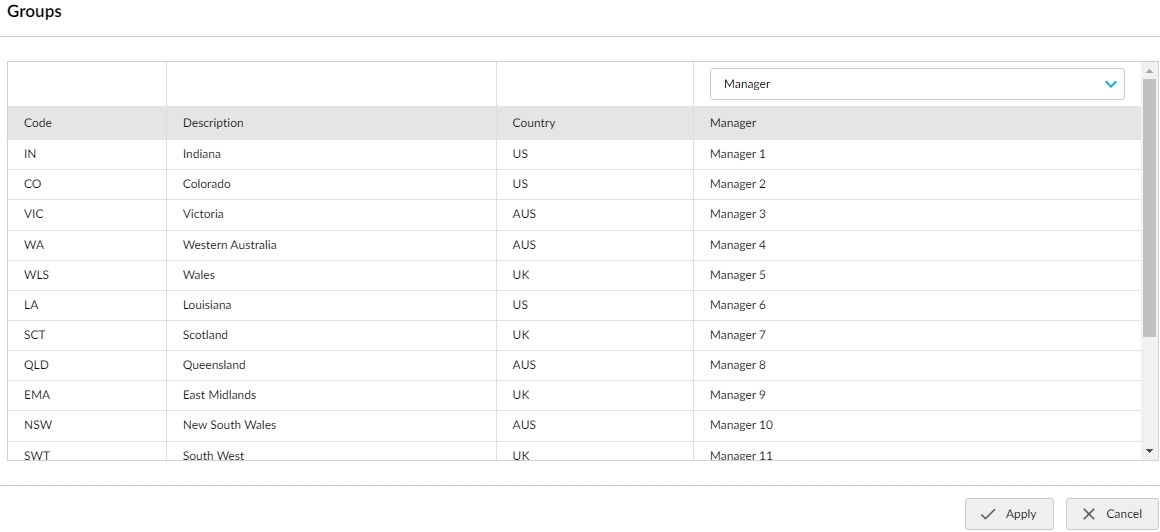
In the Groups import window, review the imported data and select the applicable dimension from the list above each column header (or select Ignore for any columns you don't want to import), then click Apply.
Rename the new group column headers, if required.
Select one of these options:
Click Save and close to save your changes without triggering a database build. Your changes will take effect on the next database build.
Click Build Now to rebuild the database immediately and apply your changes. After a successful build, you’ll receive a message asking you to refresh the page, and then you’ll see the updated group data.
Edit a group
After adding groups, you can rename or delete them and apply a custom sort order as required.
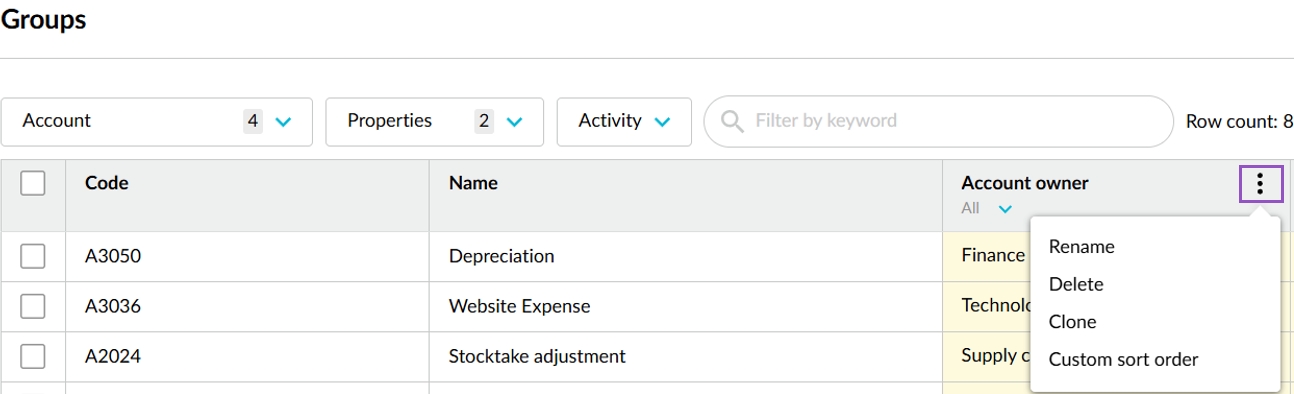
In the Groups window, select the required top-level dimension. Locate the required group in the grid, then click the menu button in its column header. Make your changes (as outlined below), then select one of these options:
Click Save and close to save your changes without triggering a database build. Your changes will take effect on the next database build.
Click Build Now to rebuild the database immediately and apply your changes. After a successful build, you’ll receive a message asking you to refresh the page, and then you’ll see the new dimensions.
Rename a group
In the group's menu, select Rename, overwrite the name, and then click out of the header to apply your changes.
Delete a group
In the group's menu, select Delete and click Delete to confirm.
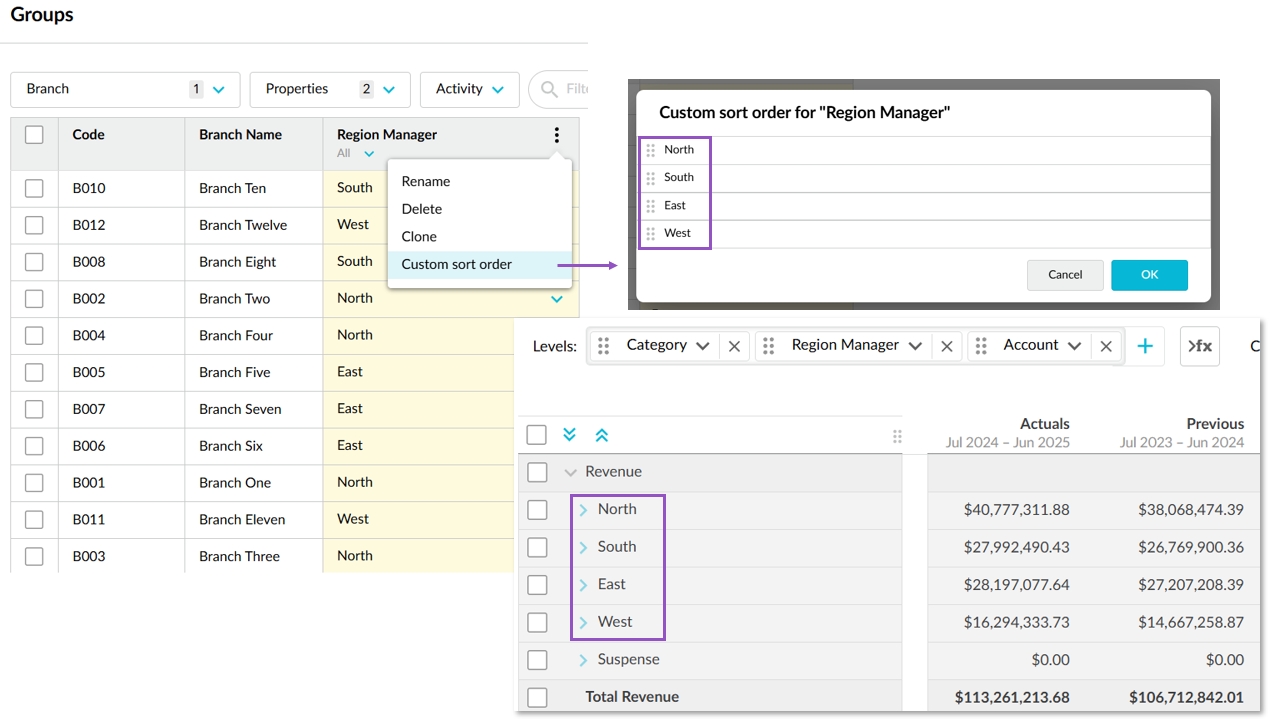
Apply a custom sort order
When you add a group as a level in the grid, its items display in a default order.
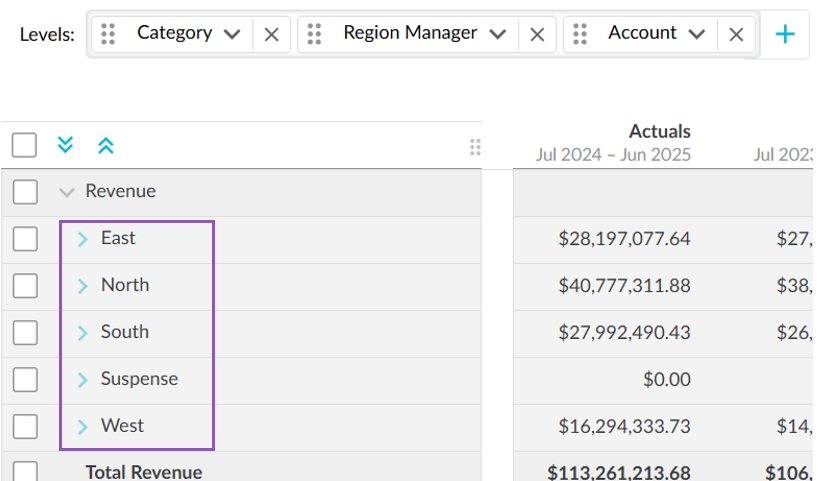
You can customize this order to meet your reporting needs. In the group's menu, select Custom sort order. Drag each item up or down to the new position and click OK.
Delete a custom sort order
To revert to the default sort order, in the group's menu, select Custom sort order and click Delete.
Export groups
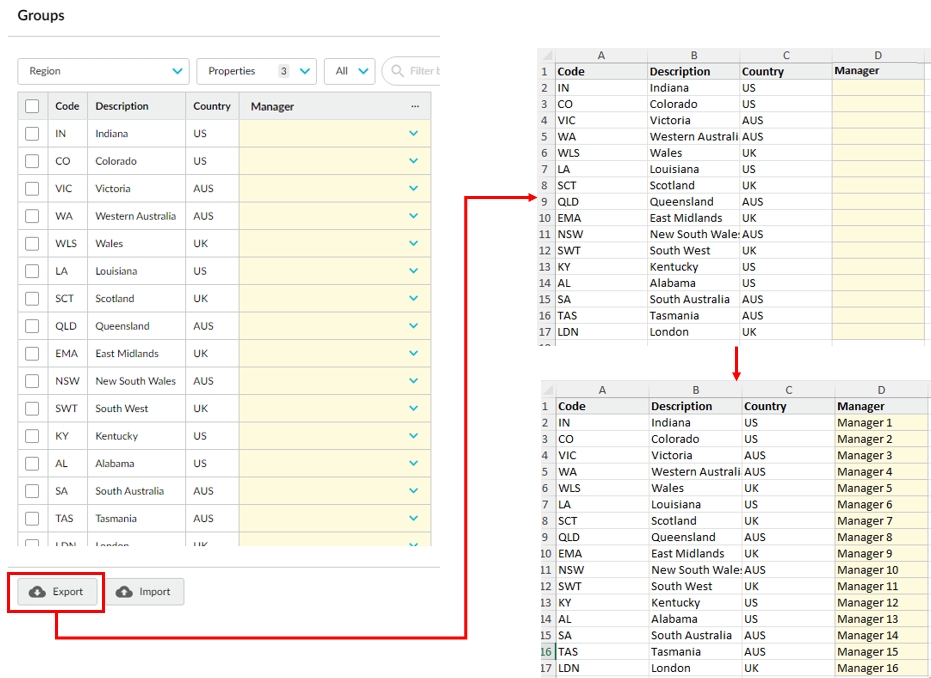
Export the data in the grid for easy validation with other sources.
In the Groups window, with the required top-level dimension selected, click Export in the bottom-left corner. The file downloads to your computer. Click the file to open it in Microsoft Excel.
You can use the exported file as a template to update the group data for that dimension. Ensure the grid has at least one group column. See Import groups.
Create sub-dimensions for accounts
See the Overview of financial statements and dimensions page for more information about the link between dimensions and your financial statements.
On September 03, 2024, we began the process of migrating the account mapping feature to Groups. As a result, all organizations now create and manage sub-dimensions in the Groups window. Any existing sub-dimensions (previously managed in the statement setup window) can now be found here in the Groups window. You now map all your accounts to these groups in the same grid at the same time, regardless of the financial statement in which they appear.
In addition to customizing the top levels of your financial statements, you can add sub-levels (sub-dimensions) to the statements to get a level of detail that you don't have in your original dataset. When you add the sub-dimension as a level in the statement grid, its entities display as sub-levels underneath the applicable category rows.
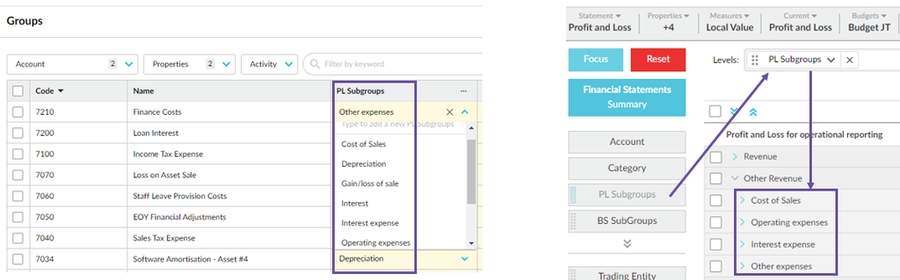
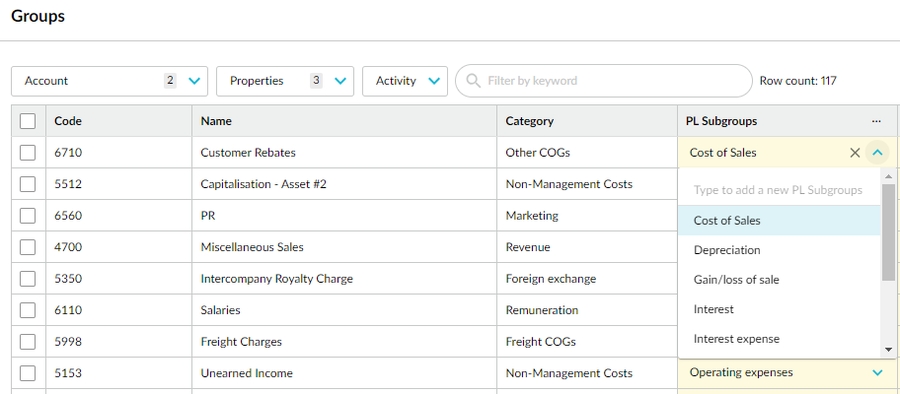
In the Groups window, select Account from the top-level dimension list. Any sub-dimensions you have for any of your financial statements will display as columns in the grid.
Use the Properties column to bring in additional information, such as the financial statement category mapping.
Add a group for a new sub-dimension, if required.
In the sub-dimension group column, add the dimension entities, then map the accounts to those entities.
Use the other groups functionality to manage your accounts, such as export to and import from Microsoft Excel to help with the mapping process, and clone a group and filter the mapped and unmapped items in each column (group). See the other sections on this page to learn how to do all of this.
Apply a custom sort order to the entities, if required.
Select one of these options:
Click Save and close to save your changes without triggering a database build. Your changes will take effect on the next database build.
Click Build Now to rebuild the database immediately and apply your changes. After a successful build, you’ll receive a message asking you to refresh the page, and then you’ll see the updated group data.
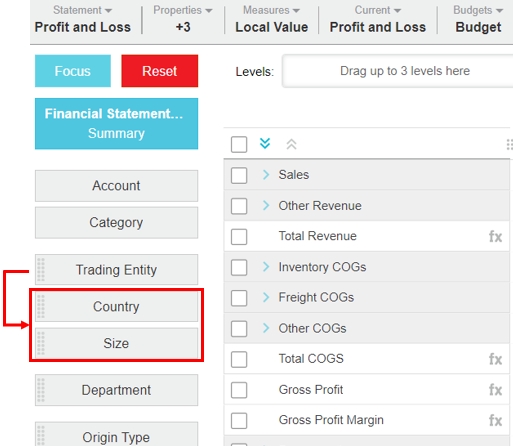
View the new dimensions in Financial Statements
After you add the groups and rebuild the database, you’ll see the new dimensions in the dimension list under the top-level dimension. You can then use these dimensions as you would use any other dimension during your analysis.
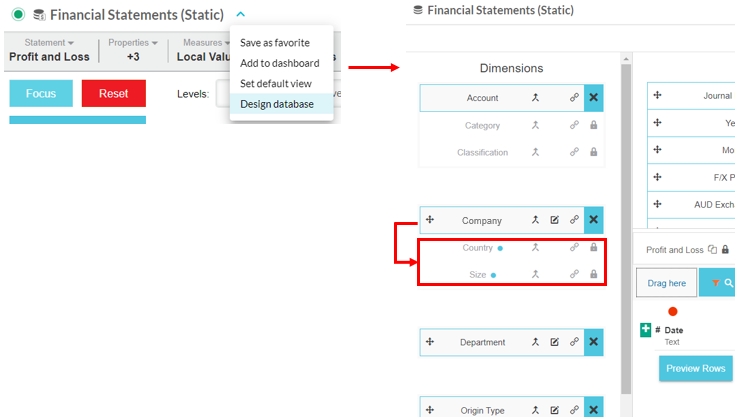
View the new dimensions in Designer
If you're an administrator with access to the Designer module, you can also view the new dimensions in the database design. In Financial Statements, click the blue menu button next to the database name and select Design database. In Designer, the dimensions are displayed underneath the corresponding top-level dimension. A lock icon indicates that these dimensions cannot be edited here, as they are managed in Financial Statements.
Last updated