LogoLogo
More help and supportPhocas website
  • Home
  • Getting started
    • Navigation
    • Homepage
    • Data access
    • User licenses, profiles and permissions
    • Account settings
    • Databases
    • Periods
      • Offset dates
      • Default period for a database
    • Sharing and folders
      • Share a dashboard, favorite, or alert
    • Subscriptions
  • Analytics
    • Take a tour of Analytics
    • Work with the grid
    • View a summary of the data
    • Customize your view (Analytics)
      • Change the mode
        • Period mode
        • Period Variance mode
        • Period Stream mode
        • Moving mode
        • Stream mode
        • Total mode
        • Transaction mode
        • Matrix mode
        • Matrix Variance mode
        • Matrix Share mode
        • Variance mode
        • Search mode
        • Market mode
        • Custom mode
      • Change the properties (Analytics)
      • Change the measures (Analytics)
      • Change the stream
      • Use the activity filter
      • Change the data format
      • Change the period (Analytics)
    • Drill down into your data (view transactions)
    • Filter data (use dimensions)
    • Select data (Analytics)
    • Focus on data (Analytics)
    • Copy or export data
    • Search for data
      • Perform a basic search
      • Perform an advanced search
      • Search for similar or comparative data (right-click filter)
    • Add levels to the grid (grid nesting)
    • Compare data with Matrix mode
    • Get more options for viewing data
    • Visualize your data in a chart
      • Bar and Column charts
      • Combo chart
      • Pareto chart
      • Waterfall chart
      • Line chart
      • Area and % Area charts
      • Pie and Donut charts
      • Bubble chart
      • Radar chart
      • Gauge chart
      • Bullet chart
      • Summary and Ring Summary charts
      • Map charts
      • Configure the chart options
      • Select and focus on a chart segment
      • Export a chart as an image
      • Use the chart legend
    • Save favorites and add to dashboards (Analytics)
    • Reset data
    • Phocas AI
    • Flex Modes
      • Switch modes
      • Filter data (Flex Modes)
      • Apply conditional formatting
      • Add levels to the grid (Flex Modes)
      • Manage columns (Flex Modes)
      • Save and share a favorite (Flex Modes)
      • View your data in a chart (Flex Modes)
  • Financial Statements
    • Take a tour of Financial Statements
    • Overview of access to financial statements
    • Customize your view (Financial Statements)
      • Change the properties (Financial Statements)
      • Change the measures (Financial Statements)
      • Change the period (Financial Statements)
      • Change the current data
      • Change the budget data
      • Change the columns
      • Change the style
      • Change the rows (activity filter)
    • Filter the financial information
    • Select and focus on data (Financial Statements)
    • Copy or export financial information
    • Add a level in a financial statement
    • View financial information in a matrix (change column groups)
    • Add and view comments (Financial Statements)
    • View transactions (Financial Statements)
    • View financial information in a chart
      • Create a Pie and Donut chart (Financial Statements)
      • Create a Value card
      • Export a financial chart widget as an image
    • Save and share favorites (Financial Statements)
    • Add financial analysis to a dashboard
    • Manage financial statements
      • Overview of financial statements and dimensions
      • Create a financial statement
      • Delete a financial statement
      • Customize a financial statement
        • Rename a financial statement
        • Reorder a financial statement
        • Customize account groups
        • Customize calculations
          • Functions for Profit & Loss calculations
          • Formulas for financial ratios
        • Customize headings and spacers
        • Set the revenue row in a Profit & Loss statement
        • Customize columns
        • Customize a Cash Flow statement
          • Common account mapping for Cash Flow statements
        • Rebuild the database
      • Set the financial year end date
      • Map the Retained Earnings account(s)
      • Restrict access to accounts
      • Manage budget streams (Financial Statements)
        • Create a budget (Financial Statements)
      • Use statistical streams
      • Use multiple currencies
      • Manage dimension groups
      • Map categories from your Chart of Accounts
  • Budgets & Forecasts
    • Overview of key terms and concepts
      • Budgets versus forecasts
      • Users and data access
      • Relationship with the Financial Statements module
      • 3-statement budgeting
      • Filtering methods
      • Demand planning
      • Loan repayments
    • Take a tour of Budgets & Forecasts
      • Explore the budget workbook
      • Explore the forecast workbook
      • Explore the Balance Sheet and Cash Flow budgets and forecasts
    • Customize your view (Budgets & Forecasts)
      • Filter a worksheet (search for items)
      • Group period columns
      • Use layouts
    • Use session filters
    • Edit values in a worksheet
      • Open workbook notes
      • Use keyboard shortcuts
      • Copy and paste values
      • Use comparison rows
      • Use sum and working lines
      • Use formulas
      • Spread totals
      • Revert to the baseline values
      • Edit the Balance Sheet budget
      • View and use headcount data
    • Refresh a workbook
    • Use workflows
      • Contribute to the workflow
      • View the workflow history
      • View workflow comments
    • View budget information in a chart
    • Open baseline, comparative, or opening balance data
    • Review the budget or forecast
      • Add and view cell comments
      • View and restore the cell history
      • View the audit log
      • Compare actuals, budgets and forecasts
    • Export a workbook or worksheet tab
    • Manage budgets and forecasts
      • Create a budget workbook
        • Filtered budget or forecast
        • Multi-currency budget
        • Unclassified data
        • Period types in budgets
        • Additional measures for driver-based budgeting
      • Create a forecast workbook
      • Clone a workbook
      • Import a budget or forecast
      • Edit the workbook setup
      • Roll a budget forward
      • Add more detail to a budget or forecast
      • Add worksheet tabs (drivers)
        • Balance Sheet and Cash Flow tabs
        • Manual Entry tab
        • Database tab
        • Headcount tab
          • Headcount tab FAQs
        • Reference tab
        • Lookup tab
        • Allocations tab
        • Scratch Pad tab
      • Manage worksheet tabs
      • Add notes to a workbook
      • Customize the format of measures
      • Manage the workflow
      • Manage user access and notifications
      • Publish a budget, forecast or other worksheet tab
      • Fix the baseline in a budget
      • Delete or restore a workbook
      • Delete a stream (Budgets & Forecasts)
      • Troubleshoot performance issues
  • Rebates
    • Overview of rebates
    • Get started with Rebates
    • Projects
    • Rules
      • Parent-child rebate rules
      • Rebates calculation methods
      • Yearly rebates
      • Quarterly rebates
      • Monthly rebates
      • Whole rule period rebates
      • Retrospective rebates
      • Pro rata rebates
    • Calculations
      • Run a calculation
      • Schedule calculations
      • View calculation results and transactions
      • Post calculation results
    • Seasonal calendars
    • Rebates analysis
    • Rebates near miss analysis
  • CRM
    • Overview of CRM
    • Agenda
    • Contacts
    • Accounts
    • Leads
    • Activities
      • Microsoft 365 Outlook calendar integration
    • Campaigns
    • CRM analysis
    • CRM administration
  • Favorites
    • Save a favorite
    • Manage favorites
    • Set a favorite as your default view
    • Use alerts
  • Dashboards
    • Use dashboards
    • Create a dashboard
    • Set a dashboard as your homepage
    • Manage dashboards
  • Administration
    • Overview of access to data (Administration)
    • Users
      • Add, update or delete a user account
        • User maintenance form
        • User permissions
      • Create a user template
      • Manage a user's database access and restrictions
      • Manage user passwords
      • Monitor user activity
      • Lock user accounts
      • Impersonate a user
    • Profiles
    • Folders (Administration)
    • Favorites (Administration)
    • Dashboards (Administration)
    • Subscriptions (Administration)
    • Periods (Administration)
      • Period types
      • Working days
    • Databases (Administration)
    • Sync Sources
    • Connectors
    • Configuration
      • Set up SSO
      • Set up SSO with Microsoft Entra ID
    • Logs
    • Designer
      • Modify a database
      • Get your data into Phocas
      • Design a database
        • Create a database
        • Add (connect) data to a database
        • Map data to the database
        • Save your database design
      • Design a financial database
      • Build a database
      • View and revert to older design versions
      • Add a budget file to a financial database
      • Add a budget file to a non-financial database (easy budget upload)
    • Sync
      • Automatically join or split items during Sync (split view)
      • Schedule the sync process
      • Migrate Sync
      • Test the sync process
    • Reserved words and characters
    • End of year maintenance tips
  • OTHER INFORMATION
    • File upload
    • Encrypt (share secrets)
    • Glossary
    • Release notes
      • Analytics release notes
      • Financial Statements release notes
      • Budgets and Forecasts release notes
      • Rebates release notes
      • Administration release notes
    • System requirements
    • Technical limitations
    • Security information
    • Scheduled upgrade and maintenance periods
    • More help and support
Powered by GitBook

© Phocas Software

On this page
  • Add the statistical stream to the database
  • View the statistical data in the financial statement
  • Add a calculation based on a statistical stream

Was this helpful?

  1. Financial Statements
  2. Manage financial statements

Use statistical streams

Add statistical data for use in your financial statements.

PreviousCreate a budget (Financial Statements)NextUse multiple currencies

Last updated 7 days ago

Was this helpful?

User permission: Financial Statements > Manage Custom Statements and Administration > Databases and Sync

You can add statistical streams (actuals and budget) to your financial statements to bring in data that doesn't come through with your General Ledger data, such as bonuses, rent, and quantity of units sold.

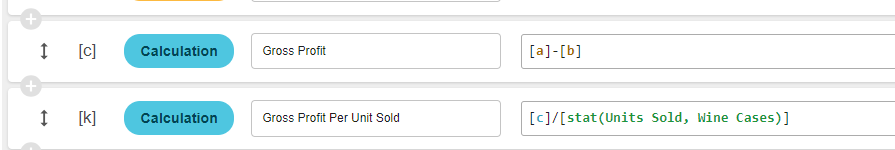
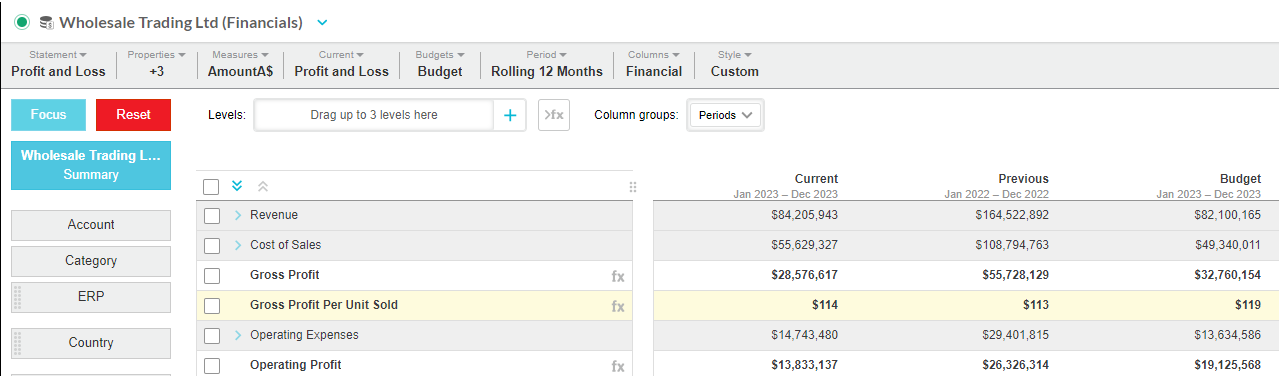
Statistical streams behave just like any other stream you add to a database, however, the calculations you can create from statistical streams significantly enhance the analysis capabilities in your financial statements. For example, you can add a statistical stream for units sold, then add calculations to the statement that allow you to analyze the Gross and Net Profit per unit sold.

Watch these videos:

  • Phocas Academy: and

  • PUG Training: (jump to 9.45)

Add the statistical stream to the database

If you have the required permissions, you complete this step in . If not, use the to request this to be done for you.

You add a budget statistical stream in the same way, but there are a few extra steps, as stated below. See the for related information.

  1. Prepare the statistical data items and add them as a sync source in Phocas (if it is not already there). A statistical stream typically contains a date, measure(s) and sub dimensions, which ideally correspond with the existing dimensions in the financial database.

  2. Open the financial database design and ensure the statistical data item is available in the data sources panel.

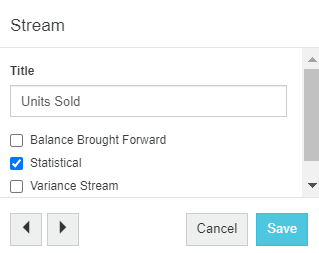
  3. Add a new stream > open the Stream window > give the stream a meaningful name, and select the Statistical checkbox. If it's a budget statistical stream, select the Variance Stream checkbox also. Click Save.

  4. Drag in the data item(s) that contain the statistical data.

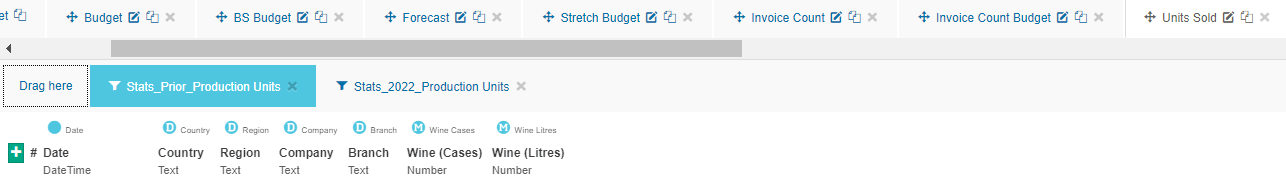
  5. Map the statistical data to the database. If it's a budget statistical stream, map to the same dimensions and measures as the actual statistical stream.

  6. Save your design changes and build the database to apply those changes.

  7. In the case of a budget statistical stream, proceed to map the budget statistical stream to the budget data set in Financial Statements. See .

View the statistical data in the financial statement

Alternatively, click the Summary button to return to the Financial Statements module, where you can add calculations that reference the statistical stream.

Add a calculation based on a statistical stream

The statement automatically updates to display the new calculation row.

After you add the statistical stream and build the database, open the financial database, (this moves you into the Analytics grid), then .

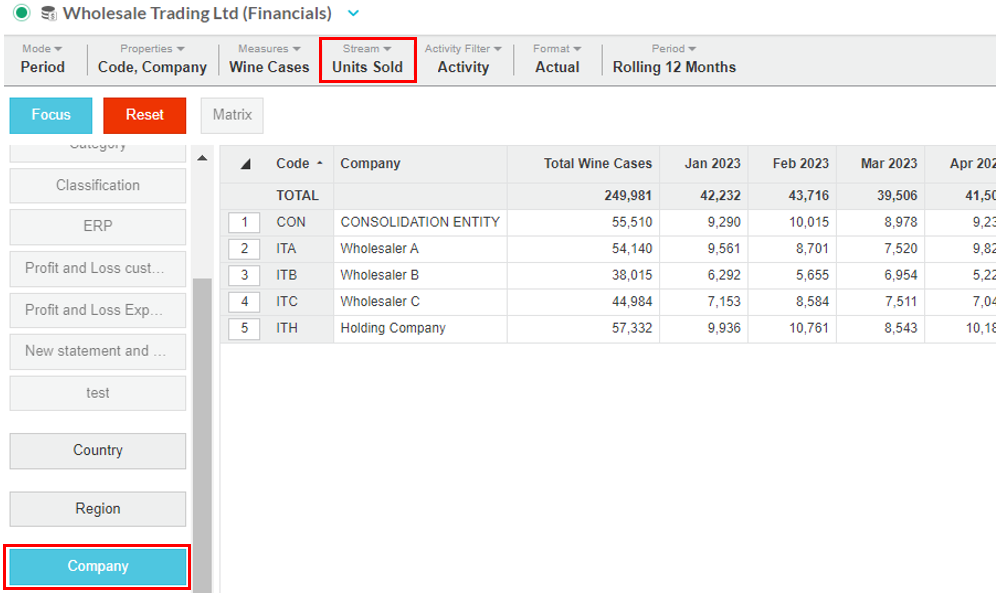
You can now use the range of Analytics tools to drill deeper into your data, all the way down to the transaction level. See the for detailed information.

In Financial Statements, click Statement > Customize statements… to open the Statements window, then select the statement to open its setup. using the to refer to the statistical stream. Save your changes and close the window.

You can create charts based on your statistical stream calculations, then .

click a stream dimension
select the stream
Analytics pages
add them to your dashboard
Bring statistical streams into a Financial Statements
Combine statistical and financial data for better business
Ratios and statistical streams
Designer
Upgrades and services form
Add a budget file to a financial database
Manage budget streams
Add a calculation
STAT function