Create a budget workbook
Start the budgeting process by creating a budget workbook.
User permissions: Budgets & Forecasts and Manage Budgets & Forecasts
The budget creation process is also referred to as the budget setup or budget configuration. The physical budgeting occurs after the workbook is created, using the workflow.
Each budget workbook is based on a Phocas database. There are two types of databases, and therefore two types of workbooks:
Financial workbooks connect to a financial database and are structured in the form of a Profit & Loss statement.
Operational workbooks connect to a database containing operational data such as sales, purchases, and inventory. They're used for planning activities outside of financial reporting and can have a flexible structure, for example, the sales breakdown (by customer, product, sales rep, channel), primary and secondary class products, pricing, expenses by provider, headcount numbers, payroll expenses, and so on.
Watch these other videos:
Phocas demo: Create a P&L budget in no time (brief overview)
PUG Training: Budgets & Forecasts 101 – revenue, Sales budgeting, and Demand planning
Prerequisites
Before you create your first budget workbook, make sure you:
Plan the budget structure: Ensure you understand how your organization currently budgets and at what level of detail. Decide whether to keep the current approach or introduce changes. It's best to define the structure before you create the workbook. After you create the workbook, you can adjust the setup. However, once you edit any budget values, most setup changes will cause data loss. See the Best practices for efficient budgeting page for guidance.
(Financial workbooks only) Complete Profit and Loss categorization:
Make sure your Profit and Loss statement is fully categorized.
Learn about how the Financial Statements and Budgets & Forecasts modules interact, and consider creating a custom statement for budgeting and forecasting.
Identify access needs: Users who need access to a budget workbook must also have access to the Financial Statements module and permission to access the underlying database. You can then assign the appropriate level of access within the workbook.
Getting started
Rather than create a new budget workbook from scratch, you can clone an existing workbook and use it as the foundation for a new workbook.
If you plan to have both operational and financial budgets, it's better to keep them in separate workbooks. Not only will this help improve performance, it'll prevent interdependencies and improve access control.
Read the Best practices for efficient budgeting page before you start creating workbooks.
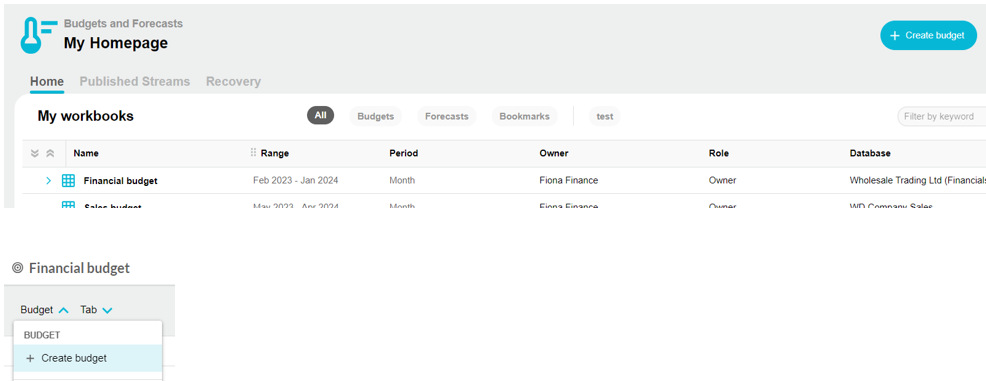
You can create both financial and operational budgets from two locations in Phocas:
Budgets & Forecasts Either: • On the Budgets & Forecasts homepage, click Create budget in the top-right corner. • Within an existing budget, click Budget > Create budget in the top-left corner.
Financial and operational
Depends on your database access:
If you have access to one type only, you skip the Create budget screen and go straight to the setup screen for that type.
If you have access to both types of databases, the Create budget screen displays, where you choose the budget type.

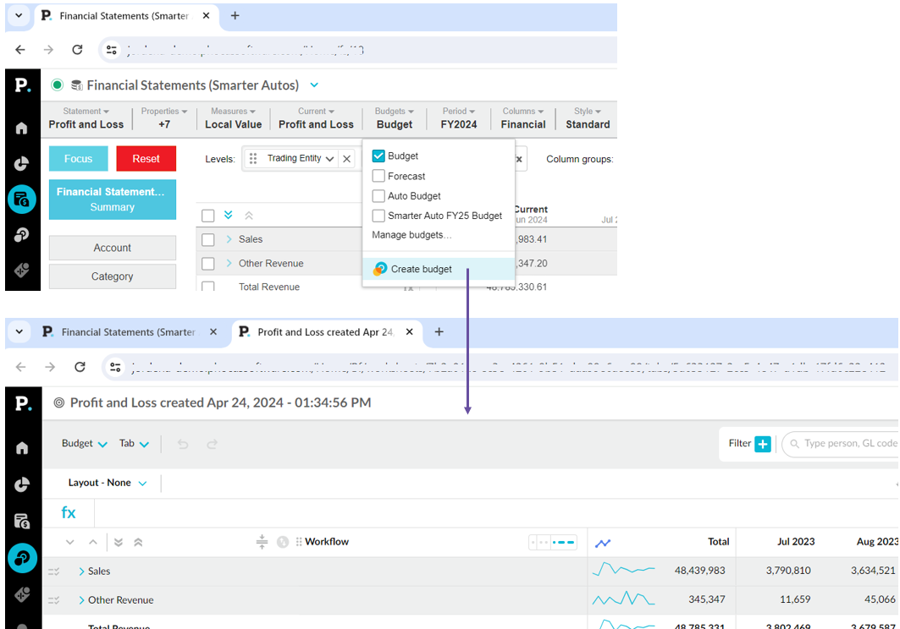
Financial Statements
Click Budgets > Create budget to automatically create the budget*.
*This is often referred to as the one-click budgeting method. See Create a budget (Financial Statements) for more information. See the Budget by region and branch page for a use case.
Financial
This method skips the manual setup outlined below, so you can jump straight to the Next steps section.
Budget setup
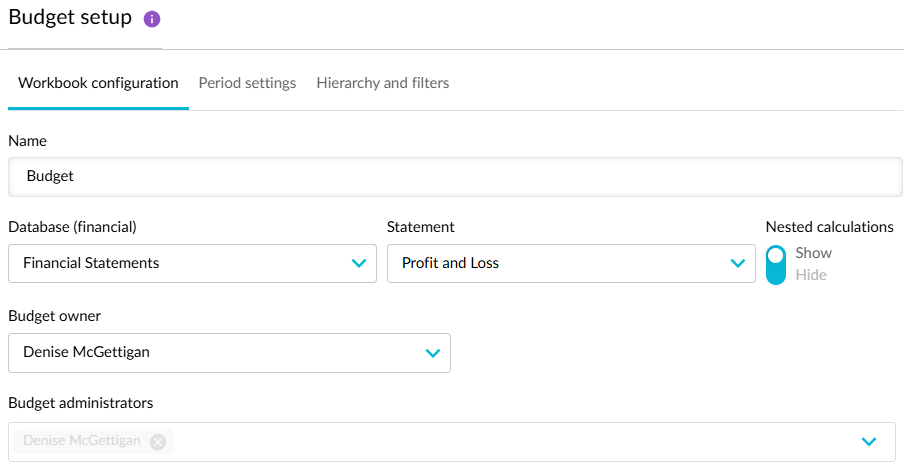
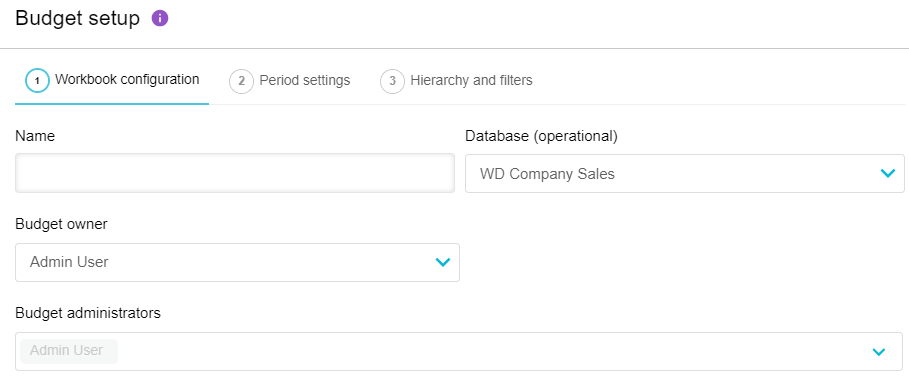
The setup process is the same for both financial and operational budgets, with only a few differences noted in the steps below. The settings are grouped into tabs, with many options automatically selected for you to save time.
Workbook configuration tab
Enter a name for the budget workbook. For example, Financial Budget 2026 or Sales Budget 2026.
Select the database on which to base the budget. This setting determines where the budget data and structure comes from. A default database is selected for you, but you might have others to choose from.
(Financial budgets only) Select the Profit and Loss statement. This setting determines the layout of the budget. A default statement is selected for you, but you might have others to choose from if your organization has created them in the Financial Statements module.
(Financial budgets only) Show or hide nested calculations as required. This setting determines whether nested calculation rows are shown in the budget or not. These calculation rows come from the selected statement. By default, Hide is selected, which means you'll only see the top-level calculation values in the budget. If you want the calculation rows to be expandable, so you can see the nested (derived) rows underneath, select Show. However, bear in mind that this introduces more data into the budget workbook, which might have a negative impact on performance.
Change the budget owner, if required. By default, you are the budget owner, as you are creating the budget. Typically, you would leave this as is, but you can select another user if you want to delegate the workflow management to them. Learn more about the types of users in Budgets & Forecasts.
Add other budget administrators, if required. By default, you are a budget administrator, as you are creating the budget. You can add other users as administrators to help you manage the workflow. Ensure the selected administrators have full access to the database on which the budget is based.
Click Next.
Period and data tab
Note on 8 September: The Period tab in the workbook setup is currently being updated. The steps on this page reflect the new design, which you will see in your Phocas site tomorrow. The updates simplify setup by organizing the settings in a logical, step-by-step order. You'll notice renamed and repositioned settings, along with other improvements. See the release note for a comparison of before and after the changes.
These settings determine the structure of the budget and the data it contains.
When you've selected the required period and data settings, click Next.
Budget period
Choose how the budget is split over time. Each time unit in the budget period is represented by a column in the grid.
Select the Period type: Year, Month or Custom (such as Quarterly).
Select the Start and End dates. For example, from April 2025 to March 2026. You can create a budget up to -3 years from the current date.
Baseline values and row structure
Choose the starting values and dimension entity rows. This can be data from a stream, or you can start with zeros.
Stream
Fill the budget with values from an existing stream of data in the database.
Choose the streams and periods that most closely match the budget period. The available options correspond to the streams that have been added to the database.
Click Add baseline to add up to three separate stream and period combinations. For example, you might want to use the Actual stream for the current year up until the most recent completed period, then use a Forecast stream or prior year actuals for the remaining. The diagram on the right of the date selector shows the period population.
The date range can be shorter than the budget period defined in the Period setup above. For example, if the budget period is 12 months but the baseline values only cover 4 months, zeros are inserted for the remaining 8 months.
Cell values will remain linked to the selected stream(s) until they are overwritten during the budgeting process.
You can fix these baseline values later to stop them from automatically updating. A fixed baseline can also help with performance issues.
Zeros
Fill the budget with zeros ($0.00), so you can start with a clean slate. The streams and periods you choose determine the dimension entity rows that are included.
Click Add rows to add up to three separate stream and period combinations.
Additional row structure
Choose streams and periods to add dimension entity rows that have no activity in the baseline value stream(s). For example, you might want to include:
Accounts that are only used at year-end and therefore, have no activity in the year-to-date actuals.
New customers or product lines that have been manually uploaded into a stream.
Measure settings
Choose how to format the numerical values in the budget grid. You can use the default formatting for the selected measure or apply a custom format by setting a prefix, number of decimal places, and suffix.
The available options match the measures in the database, such as Local Value or Reporting Value.
See the Customize the format of measures to learn more about custom formatting.
Hierarchy and filters tab
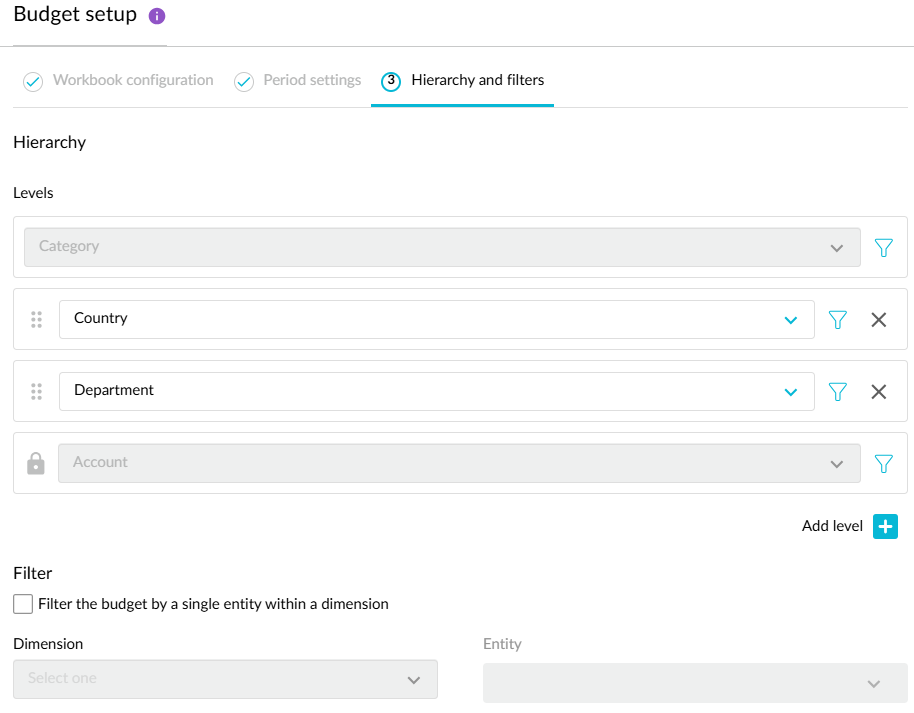
These settings determine how many levels of data are in the budget and how those levels are ordered. In other words, the hierarchy determines how the various dimensions in the database are grouped in the budget. You can leave the default hierarchy as it is or customize it to suit your needs. For example, you can add more levels of detail or apply filters. Many of these settings are optional:
Add levels:
In a financial budget, the highest level is always the Profit and Loss Category dimension, which includes items such as Revenue and Expenses. The workflow sits at the lowest level, which is typically the Account dimension. You don't need to do anything here, but you can add up to four additional levels to sit between the highest and lowest levels. The maximum number of levels any budget can have is six.
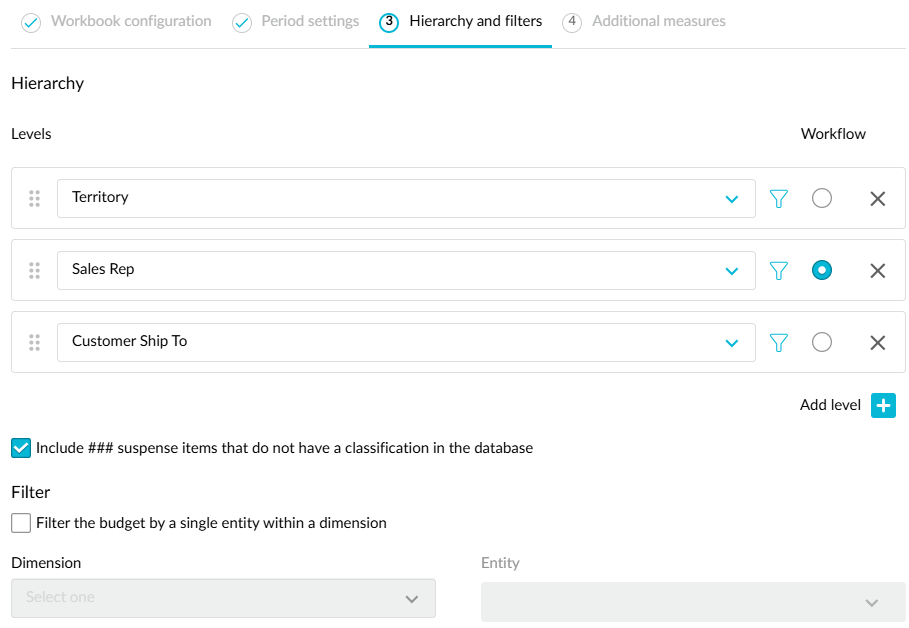
In an operational budget, you must select the dimension you want to add, such as Region, Branch, or Sale Rep. By default, the workflow sits at this level, unless you add other levels. You can add up to five additional levels to sit under the highest level. The maximum number of levels any budget can have is six.
Read the Best practices for efficient budgeting page to see how levels can impact performance.
If you add levels that don't exist in the baseline stream, the rows will contain unclassified data (###” or suspense).
You can add more levels directly into the budget later.
Reorder the levels, if required: If you add multiple levels, the order in which they display here determines the order they display in the budget, from highest to lowest level. Click the Move button on a dimension level, then drag it above or below the other level(s) to the new position as required. Remember, in a financial budget, the workflow sits on the lowest level.
(Operational budgets only) Select where the workflow sits: Select the Workflow button on the applicable level. Often, it's better to set the workflow at a higher level in the hierarchy.
Apply a filter, if required. Please see the Filtered budget or forecast page for important information and detailed steps. There are two filtering options:
Level filter using the Filter dimensions button next to the level.
Budget filter using the Filter data by a single entity within a dimension checkbox.
(Operational budgets only) Exclude ### suspense items in the budget. By default, this setting is selected, which means unclassified items are included in the workbook. If you do not want to include them, clear the checkbox.
Proceed as applicable:
For a financial budget, the setup is now complete. Click Save and finish.
For an operational budget, click Next to proceed to the Additional measures tab where you can define additional measures to drive the budget data, if required. There are several options available, and this part of the setup can be a complex task, so read the Include additional measures in the workbook page for detailed information. Click Save and finish when you're ready.

Next steps
After you complete the budget setup, or automatically create and set up a budget via Financial Statements, you should consider taking the following actions:
Explore your new budget workbook to become familiar with its key elements and features. Expand the tip below to see how the budget setup corresponds to the output.
Tip: Learn how the workbook setup impacts the workbook layout and contents...
After you create a budget workbook, it opens on the Main worksheet tab. The layout and contents of the budget are determined by your setup. In the case of a financial budget, the budget is displayed in the Profit and Loss template that you selected, as illustrated in the image below, where the colors match the setup settings with the corresponding workbook elements.
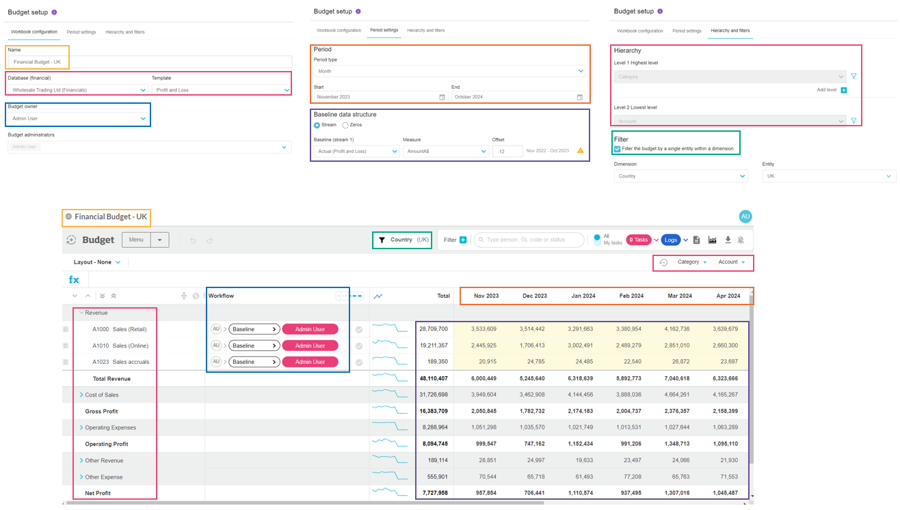
See Create a budget from within a financial statement (one-click budgeting) to see how the financial statement layout matches the financial budget setup.
Edit the budget setup, if required, before you edit any of the budget values. For example, you might want to add or remove a level. Also, if you automatically created the financial budget, you’ll probably want to change the following items at least:
Name: This automatically generated name is Profit and Loss created [date], where the data is the date and time the budget was created. You might want to replace this with something more descriptive, such as Budget by Region and Branch 2025.
Period: The date range comes from the current period of the financial statement. Typically a budget looks at the time ahead, so you’ll probably want to change this current period to a future one and use the offset option. For example, enter an offset of -12 to use the previous year's actuals (January to December 2024) as the baseline.
Fix the baseline values, if required.
Proceed to add further detail to the budget workbook as required. For example, you might want to add worksheet tabs for your Balance Sheet and Cash Flow budgets.
Start the budget workflow.
Last updated
