Take a tour of Flex Modes
Get a richer and more versatile way to explore your data.
Flex Modes provides additional Analytics functionality. It's a set of modes with different functionality to give you more flexibility in the way that you view and analyze your data.
Database and user permissions in Flex Modes
All database permissions and restrictions are applied.
Currently, the standard user permissions aren't applied and all profile settings are ignored.
In the navigation menu, click Flex Modes (underneath Analytics), then select the required database. The database opens in Flexible Period mode by default. You can then switch to another Flex mode.
More modes and the new Insights module are coming soon.

Flex Modes work much like other Analytics modes, with the same basic layout: toolbar on top, dimensions on the left, and the grid in the center. They include many familiar features plus some unique ones. Their five key elements are identified by the numbers in the image and explained below.

1. Toolbar
The toolbar at the top has menus you use to change your view of the data, and some action buttons.
Menus
Each Flex mode has its own set of menus but common menus you'll see are:
Mode: This menu lets you switch between the Flex modes. Each mode is a pre-defined view of data that displays particular columns in the grid.
Properties: This menu lets you change the properties (information stored about a dimension) displayed in the grid. The properties menu isn't available in the Summary view; you must select a dimension first.
Stream: This menu lets you change the stream (series of data in the underlying database) displayed in the grid.
Measure: This menu lets you change the measures (numerical data) displayed in the grid. The Count option allows you to replace the displayed measure value with the relative count of unique entities in a specific dimension.
Period: This menu lets you change the period (timeframe) that applies to the data in the grid.
Action buttons
All of the Flex modes have the following action buttons:
 Conditional formatting: Apply color coding to columns in the grid based on the rules you create.
 Sparklines: Turn the sparklines on or off.
 Chart builder: Open the chart builder tool to visualize your column data in a chart.
 Save as favorite: Save your analysis as a favorite
 Export: Export the data as a CSV file.
2. Focus and Reset buttons, and filter bar
The Focus button filters the data in the grid and activates after you select a dimension. The Reset button returns the grid to its original state. Use the filter bar for quick keyword searches or to open the Advanced filter pane. Applied filters show as tags on the filter bar’s right-hand side to help you track changes.
When you are working with a calculation column, the filter bar transforms into the fx (formula) bar, making it easy to identify and understand the formulas used to calculate the values in the grid.
3. Dimensions
The panel on the left displays the list of dimensions, as in other modes. However, there are two additional features:
The Nest view feature sits right above the dimensions, making it easy to drag and drop at least two dimensions into the Nest view dropzone to get a nested grid view (with levels you can expand and collapse).
When you have many dimensions, a filter displays above the dimension list to let you quickly find a particular one. Start typing the name of a dimension you're interested in, and the list is instantly filtered to show only the dimensions containing those letters.
4. Tabs
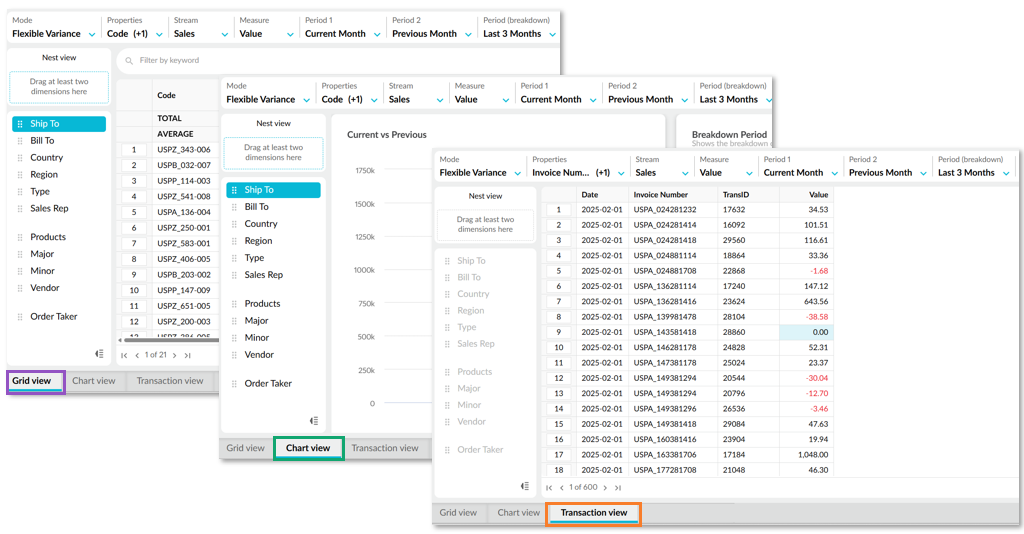
The tabs at the bottom of your screen provide different views of the data. These views mirror each other; they're based on the same data selections. For example, if you're looking at the grid and you change the period, when you go to the Chart view tab, that period is applied there too. In addition to responding to changes you make using the menus in the toolbar, the data and charts update according to the filters you apply and the dimensions you select.

Grid view: This tab opens by default. This is the standard Phocas grid you're familiar with, where you view and analyze your data. For best results, filter and focus on data here before switching to another view.
Chart view: Click this tab to view pre-built charts that allow you to visualize the data in the grid. These charts were created by Phocas for displaying the data in this particular mode. They save you time, as you don't need to create them yourself. It is possible for you to create your own charts and add them to this tab.
Transaction view: Click this tab to view the list of transactions that make up the data you see in the Grid view tab. See View transactions.
5. Grid
Just like in other places in Phocas, the grid is where you view and analyze your data. Each Flex mode has its own custom-built grid corresponding to the menus in the toolbar, along with the following features:
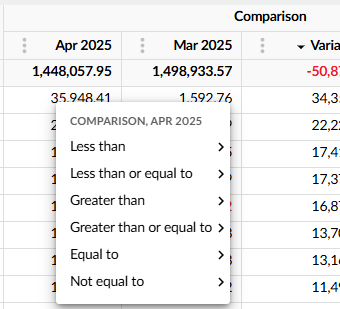
Right-click menu: A context menu that displays when you right-click a cell in a particular column. This is a handy way to do an advanced filter based on a condition directly from the grid.

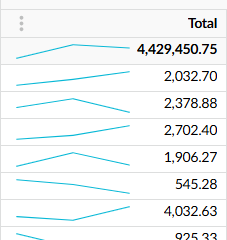
Sparklines: A column of mini charts amongst the data. Sparklines illustrate the trends over the period in a graphical format, allowing you to identify changes, trends and anomalies at a glance. For example, a sharp decrease in the sparkline might signal a drop in sales, something worth investigating.

Last updated
