Take a tour of Analytics
Learn about the key elements of the Analytics user interface (UI).
In Phocas, when you open an operational database (such as Sales, Purchasing, or Inventory) via your homepage, dashboard, or some other means, it opens in the Analytics module.
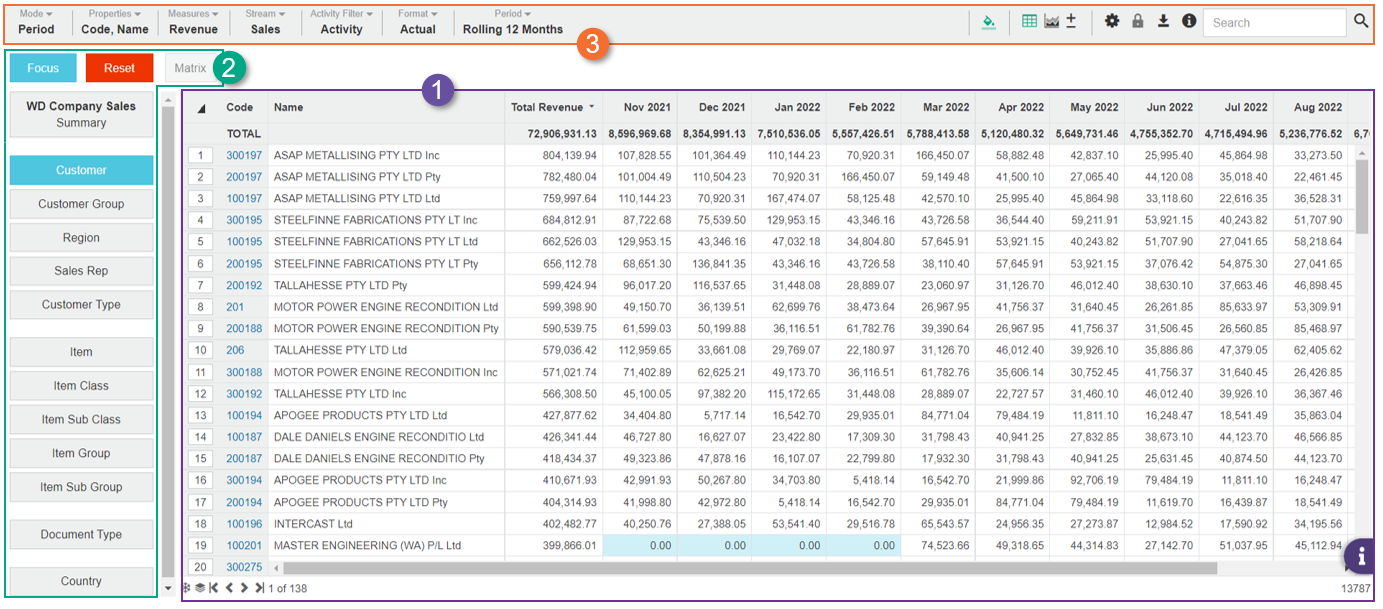
Analytics has three key elements, as identified by the numbers in the image and explained below.

The grid is where you view and analyze your data to uncover important insights and get answers to your questions. Initially, the grid displays a summary view of the data (aggregation of transactions) in the underlying database. This high-level overview of the data is the starting point for your analysis. As you drill down into the data, the grid updates accordingly.
During your analysis, the status bar (sometimes called breadcrumbs due to its appearance) displays above the grid. It shows the various selections and settings you have applied, including search criteria, matrixes, and custom periods. This information is useful when you want to review the path you've taken or remind yourself of the actions you took along the way.
In the following example, the status bar shows the actions that were taken during the analysis session. A custom period (January 2022 to February 2022) was applied, one product class (A) was selected and focused on, and three product sub classes (DL, FL and LD) were selected and focused on. When you hover over an item in the status bar, a tooltip displays more information.

Depending on your analysis, you might see the following items in the status bar:
Custom period: If you apply a custom period, a clock icon displays with the current start and end dates.
Focused data: If you select and focus on data, a filter icon displays with the dimension name, along with the code(s) of the focused data in brackets. If you have focused on more than three rows of data, only the count of those rows displays in the brackets.
Search criteria: If you search for data, a filter icon displays with the dimension name, along with the search term plus any search criteria (such as 'like') in brackets.
Matrixed items: If you select and matrix data, a matrix icon displays with the dimension name, along with the count of rows in brackets.
This information about the data is also available in the Information window.
The panel on the left has the following elements:
Dimensions: View the list of dimensions in the underlying database, such as Sales Rep or Product Class. Use these dimensions to add levels to the statement grid and filter the data to focus on specific information. You can hide this list if you want a better view of the grid.
The toolbar on the top has several menus and action buttons you can use to:
Change your view of the data in the grid, such the properties, measures and data stream that display and the time period that applies. You can also change the mode, which is a pre-defined view of data that displays particular columns in the grid.
Get more options for viewing data: Take your analysis results further, such visualize the data in a chart or export the data to another application.
Last updated
