
View your data in a chart (Flex Modes)
Visually explore and interact with your data in a chart format.
The chart builder tool in this mode is quite different from how you create charts in the other Analytics modes. It's more similar to the charting tool in the Financial Statements and Budgets & Forecasts module.
While the Chart view tab at the bottom of the grid contains some pre-built charts, you can create your own charts and add them to this tab. Charts are particularly useful when the grid has a lot of data; rather than scrolling through multiple columns or rows, you can get a visual overview of the data instead.
Create a chart
For optimal results, first filter the data in the grid to get a subset for the chart. Then either click the Chart builder button in the toolbar or click the header of the column you want to chart and click Chart column.
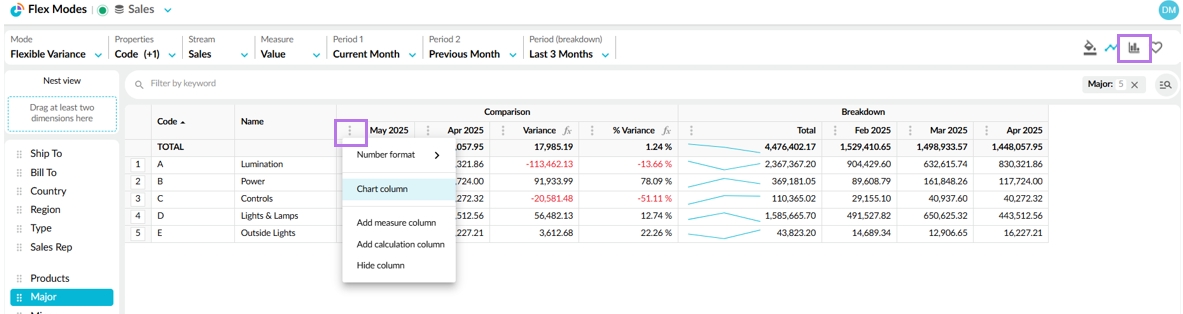
The chart builder slides out from the right of the screen, displaying data for the selected column. If you did not chart a specific column, by default, the first column is selected and charted for you. You can then select a different column and configure the chart as required.
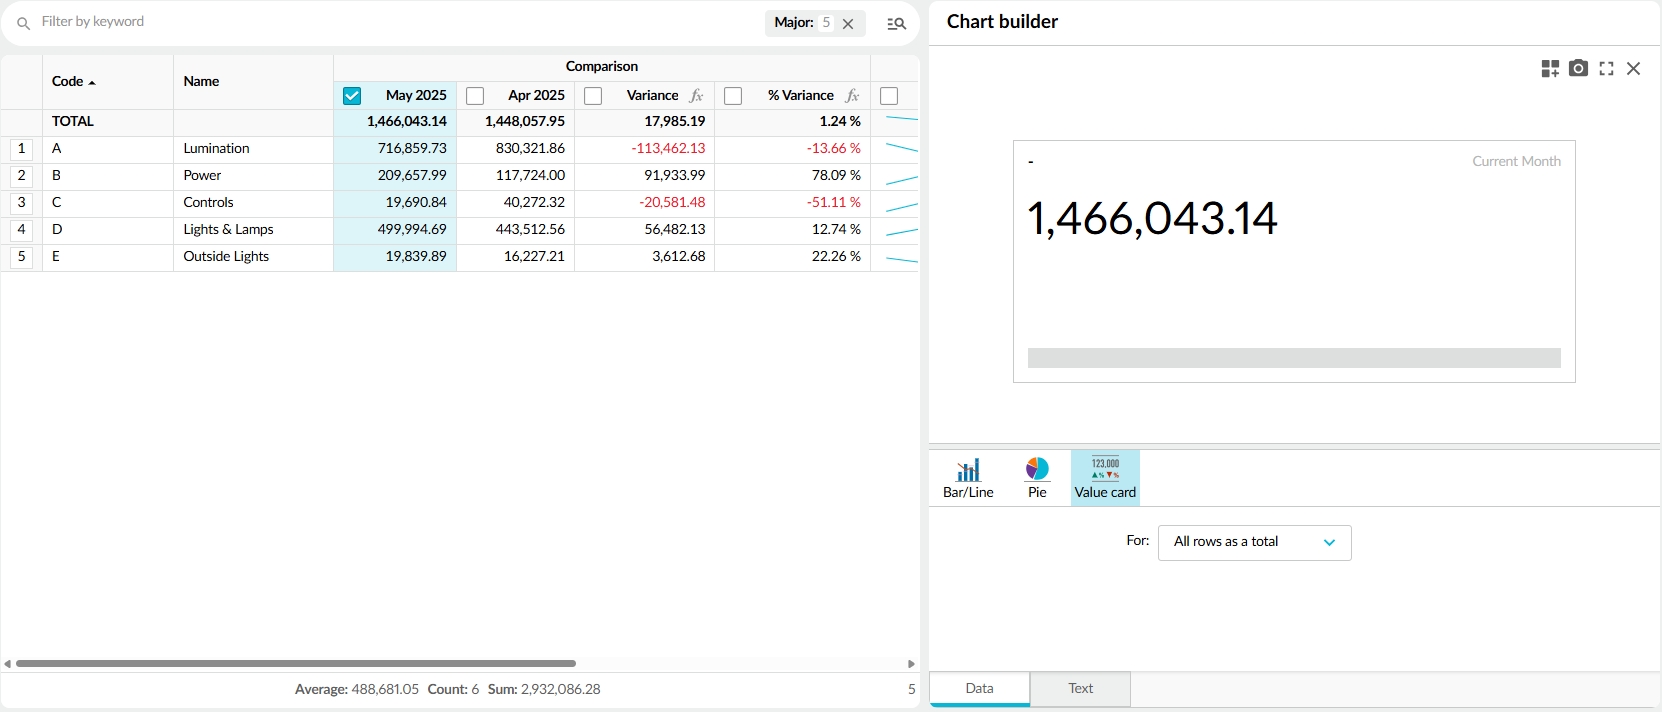
Configure the chart
View the chart in full-screen mode
Interact with the grid and chart
Scroll across the grid to view the data on the far right whilst keeping the chart in view.
Click an item in the chart legend to remove the corresponding data from the chart, then click the legend item again to display it in the chart. For example, if your chart displays data for your top 5 products, you might want to remove the lowest three products, so you can compare the top 3 products more easily.
Use the menus in the toolbar to change your view of the data and watch the chart update accordingly. Your column selection is retained. For example, you might want to apply a different period or measure.
Add a chart to the Chart view tab
You can add your chart to the Chart view tab so you don't need to recreate it the next time you open this database.
Click the Add to chart view button in the top-right corner of the chart.
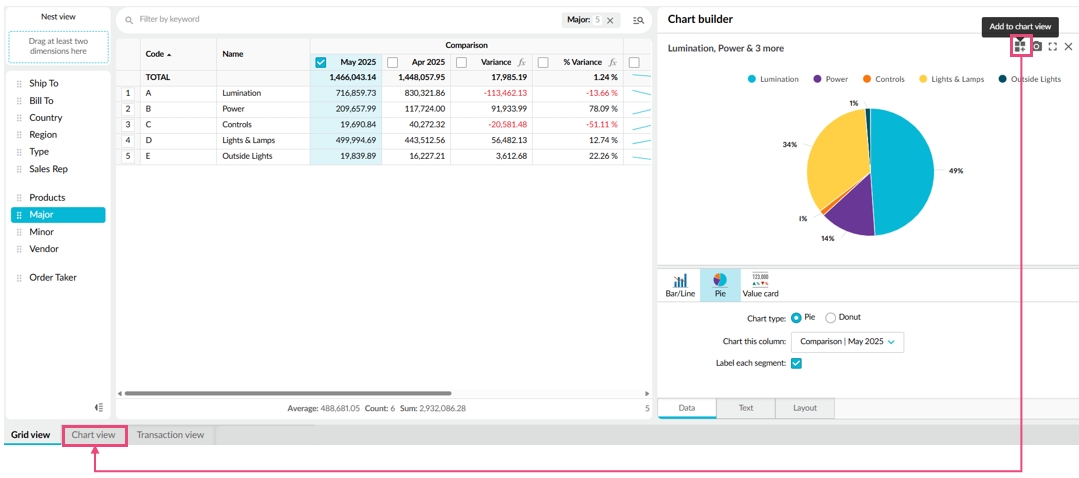
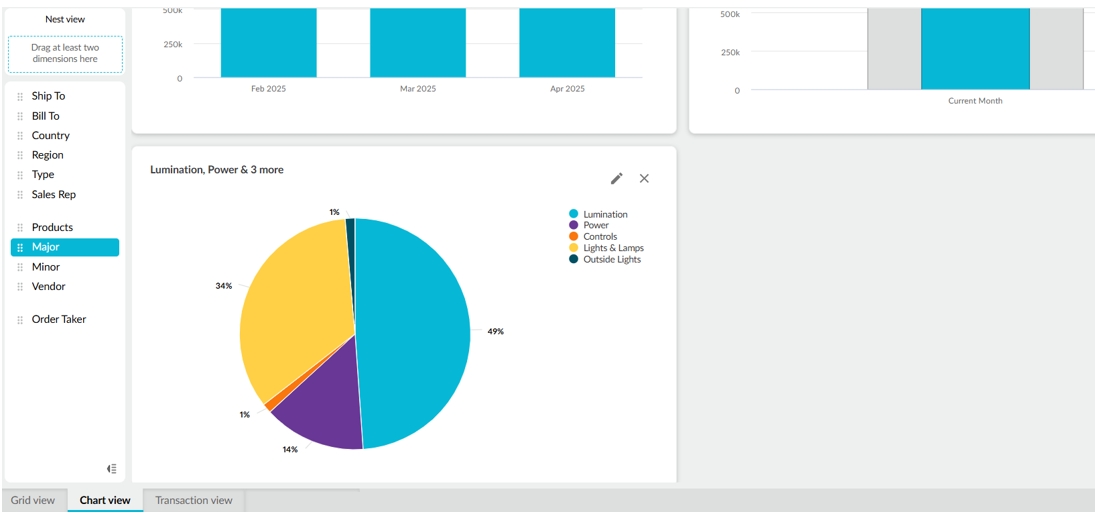
Click the Chart view tab to view your chart alongside the pre-built charts.
Close the chart builder
Was this helpful?