Switch modes
Quickly change which columns and data appear in the grid.
Use the Modes menu in the toolbar to switch between Flex Modes. Each mode is a predefined data view that displays specific columns in the grid, as outlined below. To apply a mode, open the Modes menu and select one. The grid automatically updates to show the new column layout, and the menu displays the selected mode’s name.
Flexible Period mode
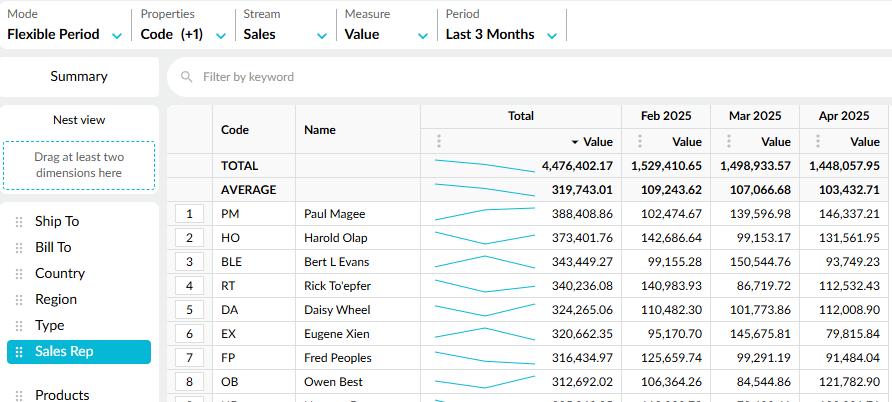
Flexible Period mode is the default view, summarizing data for the selected period with key columns like Period, Current, Previous, and Variance, plus detailed time-based breakdowns when dimensions are selected.
Menus
This mode has the standard toolbar items.
Grid
This mode has two grid views: Summary and Dimension.
Summary view
In Summary view, the grid gives you an overview of your data across the selected period. There are seven columns, starting with the Period column that displays the relevant time unit (day/month/year) for the selected period. For example, if the period is Last 3 Months, those three months display. The other columns are: Current (period), Current Cumulative, Previous (period), Previous Cumulative, % Variance and % Variance Cumulative.

Dimension view
When you select a dimension, the grid displays columns for the active properties (such as Code and Name) for that dimension, a Total column, and a column for each time unit in the period. This new layout gives you a month-by-month or day-by-day view of your data, for example. If more than one measure is selected, more columns will display.

Flexible Variance mode
Flexible Variance mode shows variance data and is useful for making comparisons over time.
You can determine what's driving the variance by selecting two different periods. You can also view the breakdown of a particular period in detail, so in effect, you can view data for three different periods in the one grid.

Menus
Along with the standard toolbar items, three Period menus offer a versatile exploration of variances in your data:
Period 1 and Period 2: These menus allow you to compare any two periods to analyze various scenarios.
Period (breakdown): This additional period menu allows you to view a breakdown of the data across a particular timeframe. You can look closely at what’s happening and see if the data is trending in the right direction. The breakdown period can be the same one you selected for Period 1 or Period 2, or another period.
Grid
This mode does not have a Summary view of the grid, only a dimension view. By default, the first dimension is selected. The grid contains the following columns and column groups:
Code and Name: These property columns display the code and name of the entities in the selected dimension. You can add other properties as required using the Properties menu. For example, if you select the Customer dimension, you might want to add the Country and Region properties to see more details about each customer.
Comparison group: This column group displays data for the periods selected in the Period 1 and Period 2 menus (from the selected stream and measure). This data comes from your ERP. From this data, the variance is calculated:
Variance (Period 1 - Period 2): This is a calculation column showing the results of the variance calculation.
% Variance ((Period 1 - Period 2) / Previous)*100: This is a calculation column showing the results of the variance percentage calculation.
Breakdown group: This column group contains:
A Total column showing the total of the data in the breakdown period columns. It also shows sparklines giving you a quick, visual summary of the data across the breakdown period.
Repeated columns which have the same structure (same stream, measure, and period) for the period selected in the Period (breakdown) menu. For example, if you select the Last three months, you’ll see a column for each of the three preceding months.

Flexible Total mode
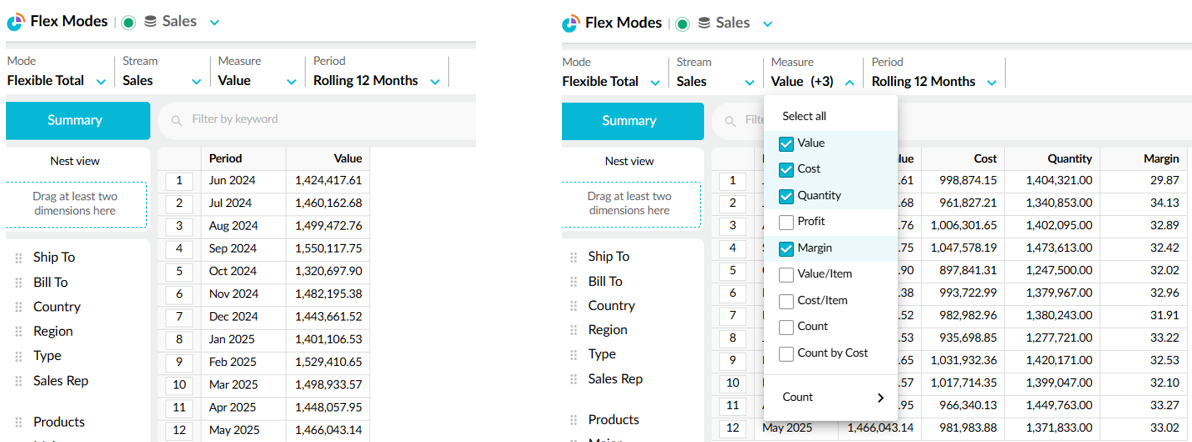
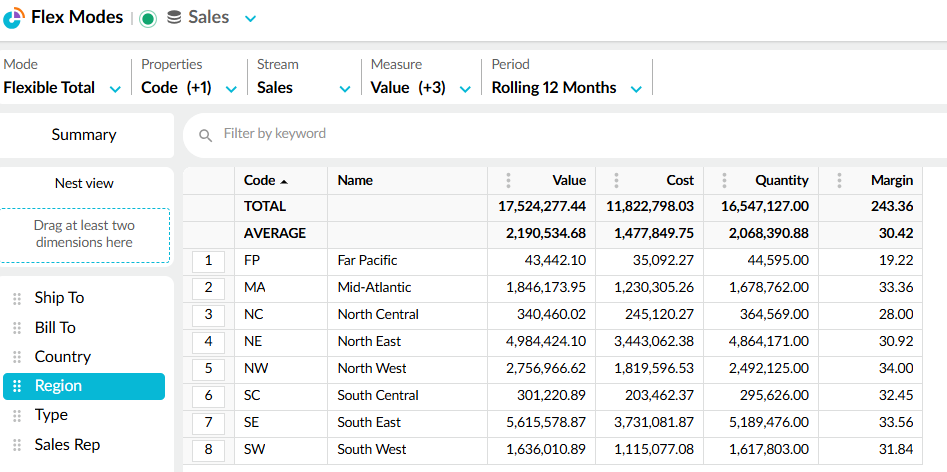
Flexible Total mode is the simplest view, removing all other columns except properties and the Total column. It’s particularly useful when multiple measures are selected, offering a clear, uncluttered summary of your data.
Menus
This mode has the standard toolbar items.
Grid
This mode has two grid views: Summary and Dimension.
Summary view
In Summary view, the grid displays the relevant time unit (day/month/year) within the current period, plus a Total column. If more than one measure is selected, more columns will display.

Dimension view
When you select a dimension, the grid displays columns for the active properties (such as Code and Name) for that dimension, plus the Total column and columns for any additional measures.

Last updated
