
Headcount tab FAQs
Here are answers to some common questions asked about the Headcount feature:
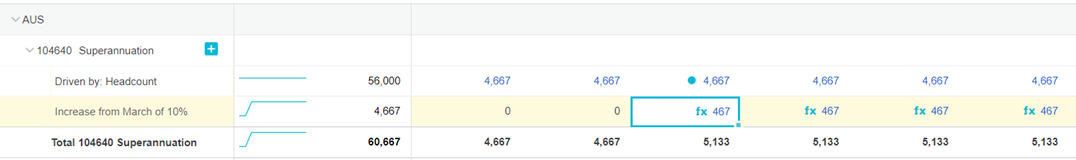
1. How do I manage superannuation?
I need to add superannuation as a benefit to calculate the superannuation. The superannuation rate increases in July this year but the budget reflects a calendar year. How can I apply the correct rate for a specified period?
Answer: Enter superannuation at the current rate in the Headcount tab, then add an adjustment in the Main tab under each occurrence of the superannuation that needs to be increased. When a Headcount row drives a General Leger row, it comes in as a sum line. You can add additional sum lines to adjust the amount that the Headcount is driving.
2. How do I revise the timing of the budgeted hires and remuneration adjustments?
I’m using the Headcount tab to drive the remuneration figures in the Main tab of my forecast but things aren’t going to plan. How do I deal with changes to headcount start dates and adjustments?
Answer: Make the required changes in the Headcount tab; all your changes will flow back to the Main tab. Watch this video for a demonstration...
3. Can I budget by headcount weekly in a monthly budget?
Answer: No, you can't budget headcount weekly in a monthly budget. When a budget is based on a database, you can only add entities that exist in the database, so if the employees to be added are in the database already but not showing in the budget due to no activity in the baseline period, they can be added, but there is no way to add entities that do not exist in the database.
To get around this, create a separate budget based on the Week period type for your headcount, then publish that budget, so it can be used in the main budget.
4. How do I adjust for seasonality?
The benefit cost in my Headcount tab is driving the Benefit account row in my Main tab. It's spread evenly across the budget period, but that doesn't reflect what really happens in my company. We only pay benefits twice a year. How can I make adjustments to the automatically driven values to account for this seasonality?
Answer: By default, the output of the Headcount tab is spread evenly across the budget period in the corresponding driven row in the Main tab. You can adjust this spread to add seasonality to the budget.
The following video demonstrates two options for adjusting for seasonality:
Add two working lines, one to reverse out the original value (default spread) and another for the seasonality adjustment.
Add one working line for the seasonality adjustment.
5. How do I align my headcount data with my pay cycle?
Answer: It's common to have pay periods that don't align with the other data in your financial budget. For example, you might want to pay employees every week, which would generate 52 pay periods, or every two weeks, which would generate 26 pay periods.
The following video demonstrates how to align headcount data with a pay cycle using:
A Manual Entry tab to manage the pay periods effectively.
Sum rows in the Main tab for adjustments, along with the Spread feature, to ensure payroll information is spread accurately across the months in the budget.