Explore the forecast workbook
Learn about the key elements of a forecast workbook.
User permission: Budgets & Forecasts
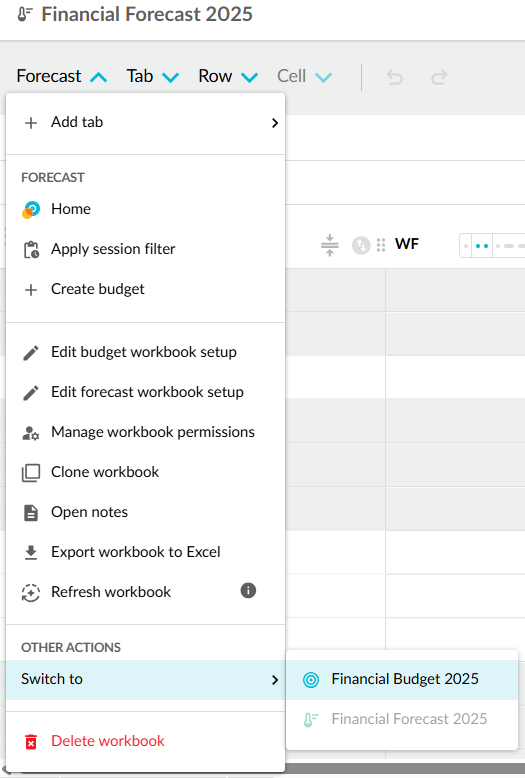
A forecast is always based on a budget. The budget owner creates the forecast by saving a budget workbook as a forecast workbook. You can then quickly switch between the budget and forecast workbooks via the Budget menu in the top left corner.

You can also quickly access your forecast workbooks from your Budgets and Forecast homepage. Click the Forecasts button to filter the list and see only the forecast type of workbooks.

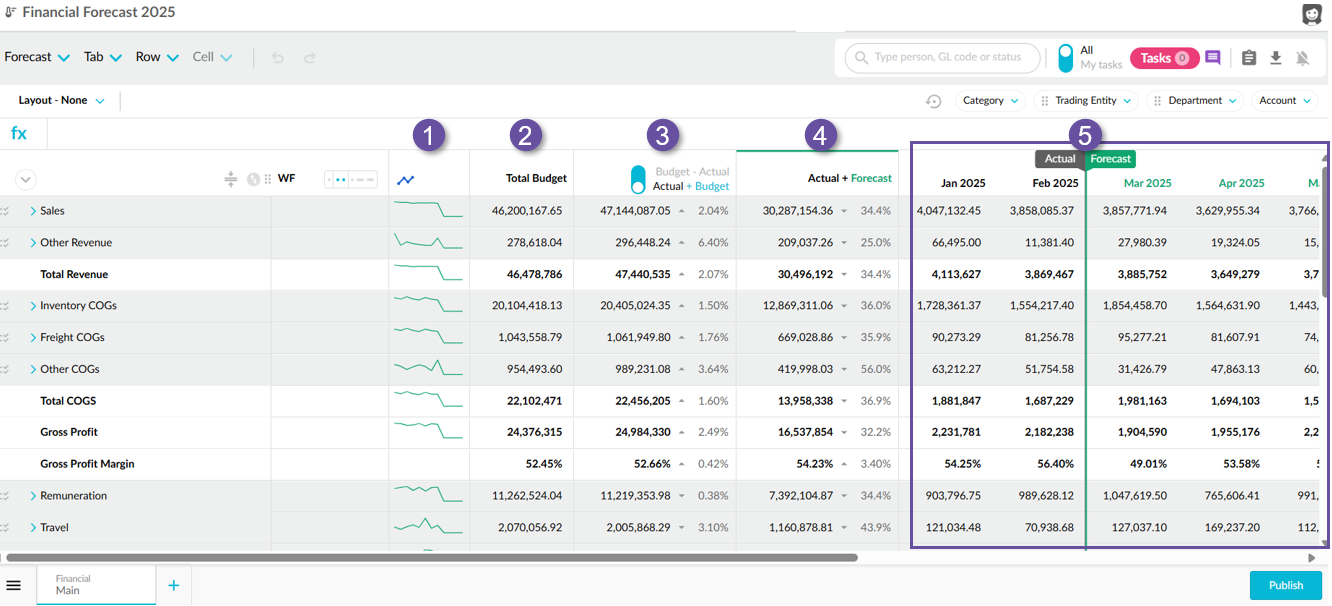
The Main tab of the forecast workbook has all the same elements as that of a budget workbook, along with some extras. You can quickly differentiate a forecast from a budget workbook by the Forecast menu in the top left corner and the green flagpole in the grid. The most notable additions are the three total columns (Total Budget, Actual + Budget, and Actual + Forecast) which serve as buttons to switch between different data views.
Below is an annotated screenshot highlighting the key areas of the forecast workbook interface, including the flagpole, period columns, and data views.
In addition to the these elements, the forecast workbook also has some additional spread functionality.
A Balance Sheet forecast has some different elements.

1. Sparklines
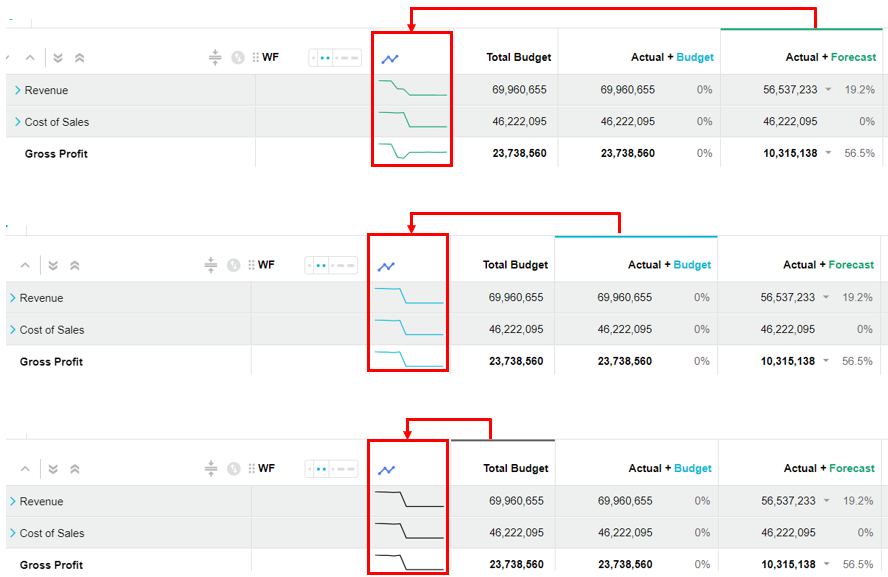
Sparklines display in budget and forecast worksheets by default but you can hide them if they're not required. In a forecast, one sparkline column displays before the three total columns. This sparkline column is dynamic and each sparkline updates in real-time as you work with the forecast, such as:
When you select a total column, the corresponding sparkline displays in the sparkline column. When you select a different total column, the sparkline updates accordingly. The color of the sparkline denotes which total column it represents.
When you move the flagpole, the sparkline updates accordingly to reflect the values you see in the forecast grid at that point in time.
If you change the data in the grid, the sparkline updates instantly, so you can immediately see the impact of your changes.

2. Total budget
The Total Budget column shows the total of the planned or expected financial values for each account or line item for the full period. For example, Sales has a budget of 46,200,167.65.
When you click this column, the grid updates to show the original budgeted figures for the period, serving as a baseline for performance comparison.
The data in the grid is non-editable, as it reflects historical data imported from your financial system. It serves as a reference for the original budget.
Instead of a flagpole, a dotted vertical line appears to mark the end of the most recently completed month.
3. Budget versus actual
This dual-purpose column compares actuals to budgeted values and displays the variance percentage, showing whether actuals exceeded or fell short of the budget. Clicking this column activates a toggle with two modes:
Actual + Budget
This is the default mode, showing the combined total of the actual values up to the current period and budgeted values for future periods based on the forecast structure (such as 1+11, 3+9, and so on). This combined view helps in comparing actual performance against the planned budget.
In the grid, the actuals appear to the left of the flagpole, and the budget values to the right.
The data in the grid is non-editable, as it reflects historical data imported from your financial system. It serves as a reference for the original budget.
This view of the data is especially useful during early-stage reforecasting, as it provides a view of the original budget.
Budget - Actual
This mode shows the remaining budget: calculated as Budget minus Actual.
The data in the grid is non-editable, as it reflects the original budgeted values and historical data imported from your financial system.
This view of the data is useful for tracking how much budget is left, particularly for cost-sensitive areas like projects or expense accounts. Expand line items to drill down to the lowest levels, such as individual expense accounts.
4. Actual plus forecast
The Actual + Forecast column is the default active column when you open the forecast workbook. It combines the actuals values up to the current period and forecasted values for future periods, offering a full-period projection.
The grid updates to show values based on the selected forecast setup, such as 3+9. Actuals display to the left of the flagpole; forecasts appear to the right.
In the grid, the forecast cells are editable, making this the main workspace for reforecasting. You can enter the most recent forecasted figures, reflecting updates based on actual performance and anticipated changes.
Initially, forecast values match those in Actual + Budget, but you can override them as needed.
5. Grid and flagpole
The grid contains the actual, budget, and forecast values for each month. The data you see is determined by your current view (Selected total column) and the flagpole position. Any formulas present in the original budget workbook are retained in the forecast view.
The flagpole is a vertical marker that distinguishes between actual data and forecast data:
The default position of the flagpole is the end of the last completed period, separating actual data (left) from forecast data (right).
You can drag the flagpole to earlier periods to review historical forecasts or budgets, facilitating performance analysis over time. You can't drag it forward past the current period, as no actual data exists for future months.
