
Filter a worksheet (search for items)
Part of customizing your view of a budget or forecast worksheet involves filtering the worksheet to remove rows that you do not need to see, so you can focus on the rows that are important to you. You can filter a worksheet in several ways.
When you apply a filter to a worksheet, it’s just for viewing purposes. It does not impact the publishing process. The whole budget will still be published.
Impacts of filtering
Filtering can have an unexpected impact on totals and calculated cell values. When you filter out dimension entities, the related cells are removed from the grid. If any formulas or totals reference those cells, their values will change.
You can reduce the impact by turning on nested calculations and referencing the dimension entity total. However, if you apply filters across multiple tabs, the displayed totals might still be impacted. To avoid conflicts when analyzing multiple tabs, use session filters instead of individual tab filters.
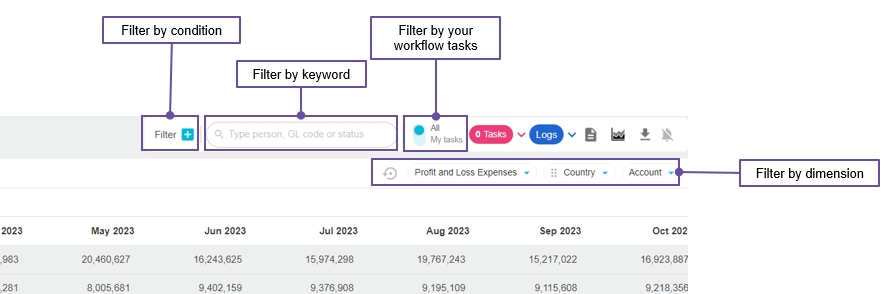
Filter by condition
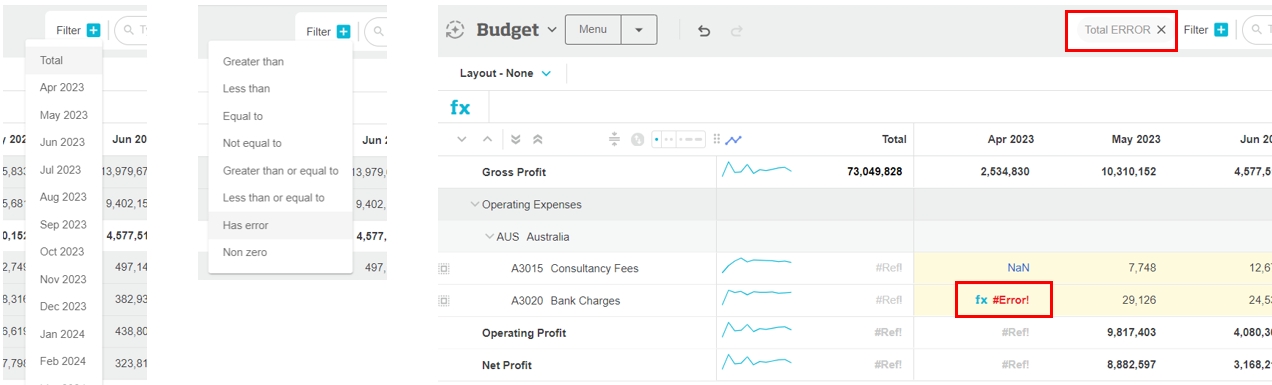
The filter by condition option is available in budget workbooks only, in all worksheet tabs except for the Headcount. It allows you to quickly:
Find out if a particular value exists in the budget, perhaps when investigating an anomaly. For example, are there any expenses > 1,000 in December?
Check for any errors in the budget.
Click the Filter button, select a column to filter, then select condition. If you select an operator, such as Greater than, Less than, and so on, enter your criteria and press Enter. The grid is filtered instantly, to display only the rows that match the condition. You might need to expand the rows to view the results.
For example, in the following image, the filter was used to identify cells with errors.
Filter by keyword (search for an item)
The search functionality works on the first two columns in the worksheet, the budget hierarchy and workflow. It is a handy option when you want to quickly find a specific row (budget line item). It’s also useful if you are managing the workflow and you want to find all the rows assigned to a specific user or all the rows in a specific workflow status.
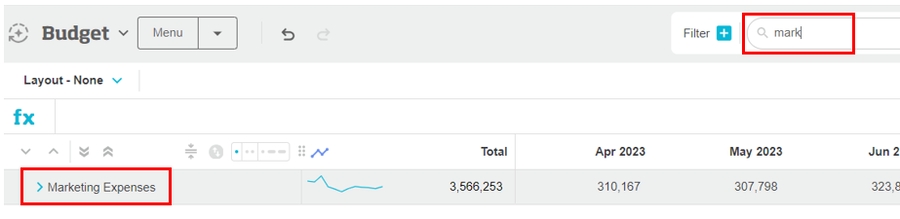
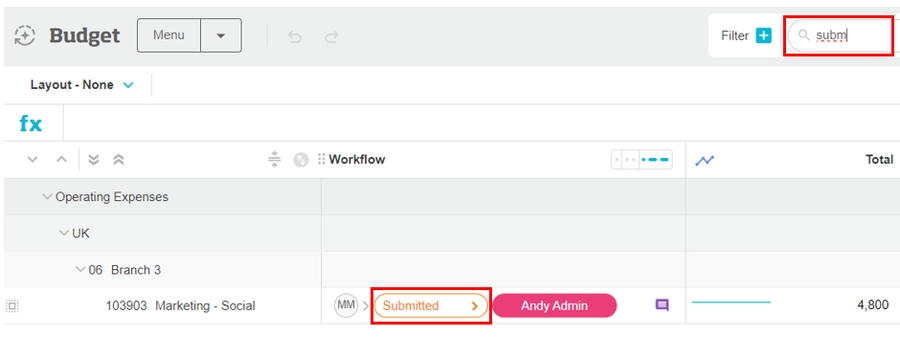
Start typing a keyword into the search box. For example, marketing, revenue, A1010, bill, submitted. The grid is filtered dynamically as you type, to display only the rows that match your search term.
Examples
Suppose you are the Marketing Manager, so you want to jump straight to the Marketing expenses in your financial budget:
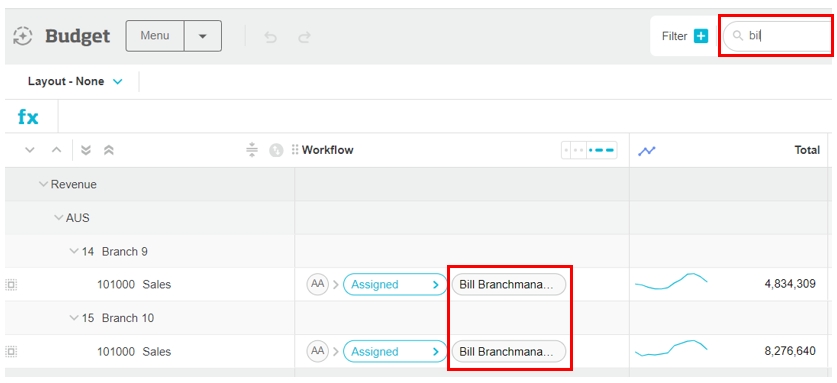
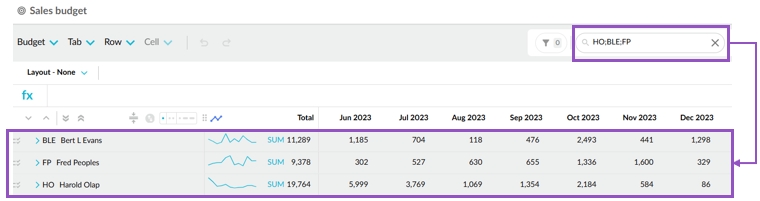
Suppose you are checking that your team member Bill has completed his part in the workflow in the Sales budget:
Suppose you are the workflow owner and want to review all submitted rows:
You can use an asterisk character to perform a wildcard search. This is particularly useful when trying to find a specific account code. For example:
*100 returns matching items that end with 100, such as 220100.
100* returns matching items that start with 100, such as 100125.
To do a contains search, put an asterisk on both sides of the search term, such as *100*, such as 220100, 100125, and 100100.
You can also use semicolon separated values to search for multiple items at the same time, such as a specific group of customers or products.
Filter by your workflow tasks
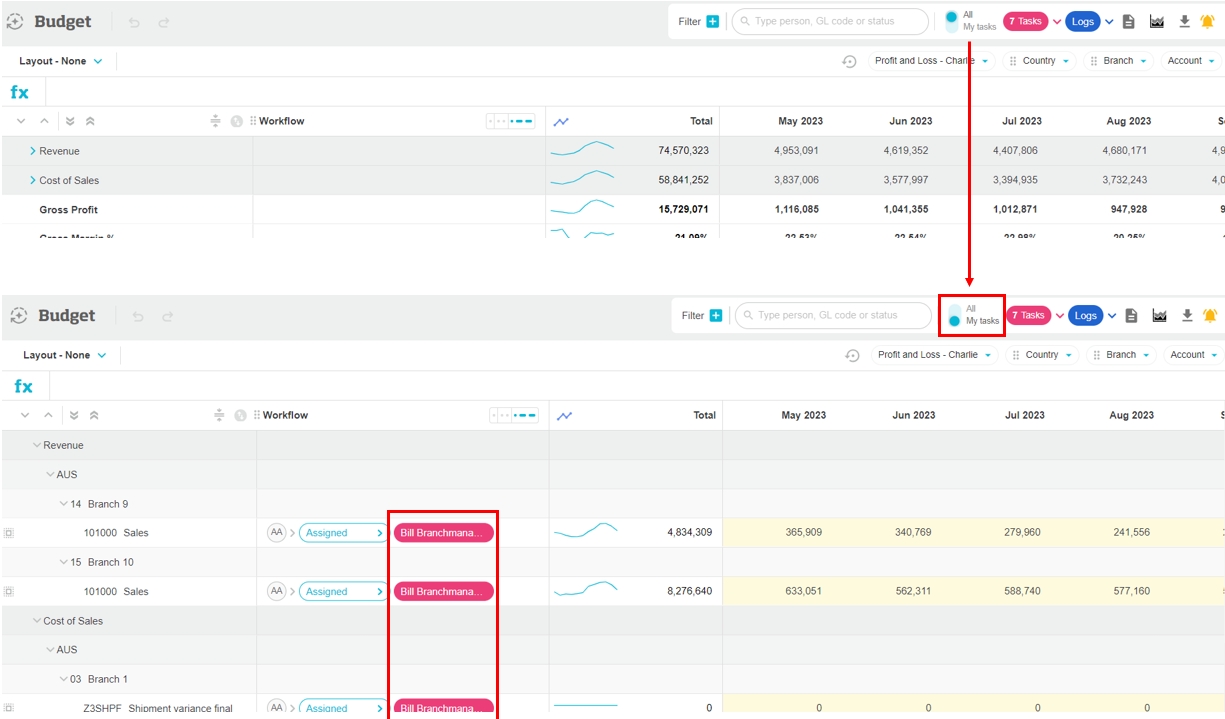
The All/My tasks button allows you to instantly filter the budget to view only the rows that have been assigned to you in the workflow.
For example, in the image below, Bill Branchmanager is signed in to Phocas and viewing the budget. When he clicks the All/My tasks button, he sees the seven tasks (rows) assigned to him.
Filter by dimension
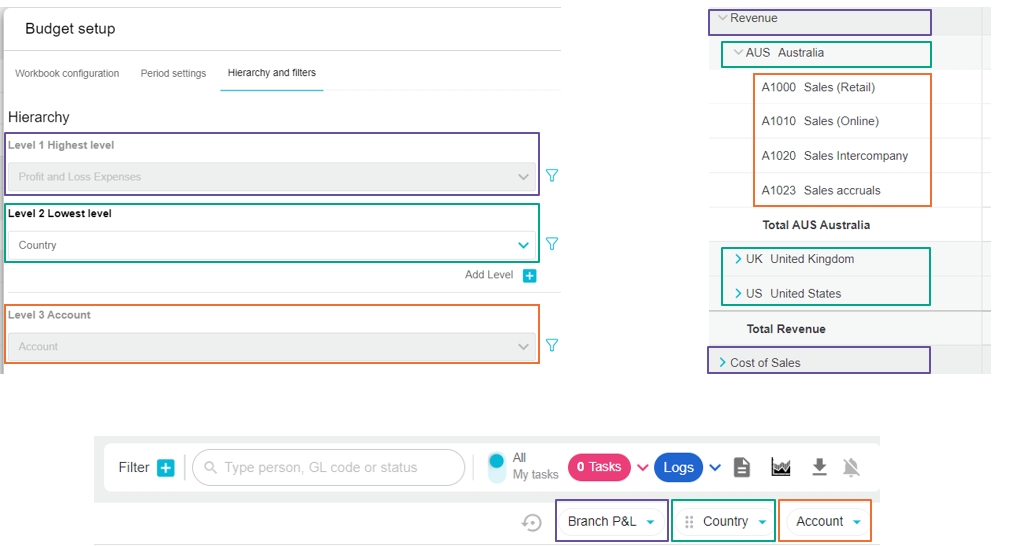
The budget setup determines the layout of the budget worksheet - how the items are grouped in the worksheet and the order in which those groups are displayed. The groups are based on the dimensions in the underlying database and displayed in order of hierarchy. In the worksheet, there is a filter for each dimension.
Whereas the budget owner and administrators can apply a filter in the budget setup, you can use the dimension filters within a worksheet to achieve a similar result. This action reduces the noise in the budget, so you only see the items that interest you, such as a specific region, sales rep, product or account.
Click the applicable dimension button on the top-right above the grid to display the list of entities in that dimension. Select the checkboxes of those you want to see in the budget. Click out of the box to apply the filter. The grid is filtered instantly, to display only the data for the selected dimension entities. The total values you see apply to that selection, so they are a subset of the overall budget values.
You can apply filters to the other dimensions in the same way. When you do so, the dimension entity lists are dynamically filtered for you to show a subset of entities based on the filter you have already applied. For example, if you first filter by the Country dimension to show only Australia, then go to filter the Sales Rep dimension, you'll only see the sales reps for Australia in the list.
Click the Reset button to the left of the dimension buttons to remove the filter.
Examples
Suppose your organization operates in three countries. You are a manager in the UK, so you only want to see the UK Sales budget. You filter by Country > UK. The budget looks the same but the values are for the UK values only.

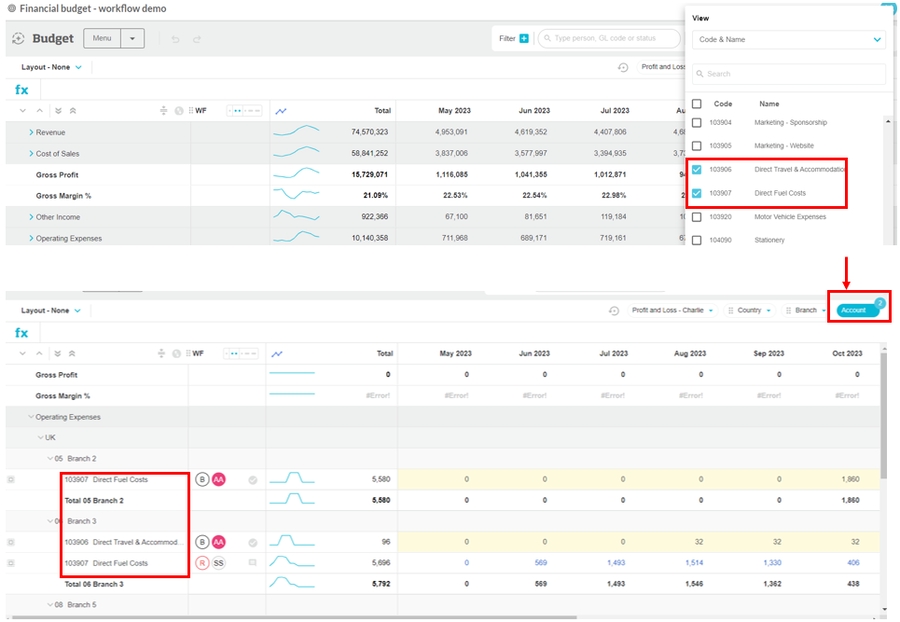
Suppose you are responsible for the travel expenses and want to view the budget rows for the travel-related expenses. You filter by Account and select the two accounts you are interested in. The budget displays the rows for the selected accounts, along with the total rows. The total rows have errors, as they are missing data as a result of the filter.
Last updated